
Compare Ram Info with Similar Stocks
Stock DNA
Computers - Software & Consulting
INR 38 Cr (Micro Cap)
20.00
20
0.00%
-0.24
2.58%
0.54
Total Returns (Price + Dividend) 
Latest dividend: 0.9938563327032137 per share ex-dividend date: Aug-04-2023
Risk Adjusted Returns v/s
Returns Beta

News

Ram Info Ltd is Rated Strong Sell
Ram Info Ltd is rated Strong Sell by MarketsMOJO, with this rating last updated on 16 Feb 2026. However, the analysis and financial metrics presented here reflect the stock’s current position as of 02 July 2026, providing investors with an up-to-date view of its fundamentals, valuation, financial trends, and technical outlook.
Read full news article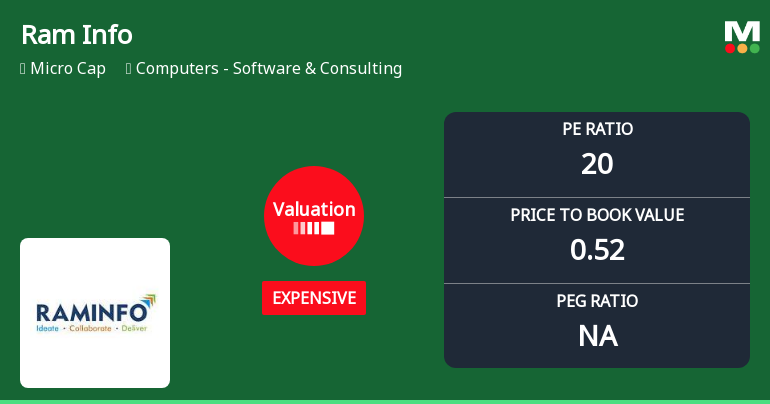
Ram Info Ltd Valuation Shifts Signal Price Attractiveness Amid Sector Challenges
Ram Info Ltd, a micro-cap player in the Computers - Software & Consulting sector, has seen its valuation parameters shift notably, moving from a very expensive to an expensive rating. Despite a modest day change of -0.07%, the company’s price-to-earnings (P/E) and price-to-book value (P/BV) ratios reveal a nuanced picture of price attractiveness amid challenging returns and sector comparisons.
Read full news article
Ram Info Ltd is Rated Strong Sell
Ram Info Ltd is rated Strong Sell by MarketsMOJO, with this rating last updated on 16 February 2026. However, the analysis and financial metrics discussed here reflect the stock’s current position as of 18 June 2026, providing investors with the latest insights into its performance and outlook.
Read full news article Announcements
Compliances-Certificate under Reg. 74 (5) of SEBI (DP) Regulations 2018
04-Jul-2026 | Source : BSECompliance under regulation 74(5) of SEBI (Depositories and Participants) Regulations 2018 for Quarter Ended June 30th 2026.
Closure of Trading Window
26-Jun-2026 | Source : BSEClosure of Trading Window for Quarter Ended 30-06-2026
Announcement under Regulation 30 (LODR)-Newspaper Publication
30-May-2026 | Source : BSEAnnouncement under Regulation 30(LODR)- Newspaper Publication
Corporate Actions

No Upcoming Board Meetings

Ram Info Ltd has declared 10% dividend, ex-date: 04 Aug 23

No Splits history available

No Bonus history available

No Rights history available
Quality key factors
Valuation key factors
Technicals key factors
 Technical Indicator Scale: Bearish, Mildly Bearish, Sideways, Mildly Bullish, Bullish Turned
 Shareholding Snapshot : Jun 2026
Shareholding Compare (%holding)
Non Institution
None
Held by 2 Schemes (0.0%)
Held by 2 FIIs (0.0%)
Rras Technologies Private Limited (25.62%)
None
45.03%
Quarterly Results Snapshot (Consolidated) - Mar'26 - YoY

YoY Growth in quarter ended Mar 2026 is 125.00% vs -82.03% in Mar 2025

YoY Growth in quarter ended Mar 2026 is -76.79% vs 33.33% in Mar 2025
Half Yearly Results Snapshot (Consolidated) - Sep'25
Growth in half year ended Sep 2025 is 95.25% vs -66.94% in Sep 2024
Growth in half year ended Sep 2025 is -27.00% vs -71.35% in Sep 2024
Nine Monthly Results Snapshot (Consolidated) - Dec'25
YoY Growth in nine months ended Dec 2025 is 93.62% vs -71.76% in Dec 2024
YoY Growth in nine months ended Dec 2025 is 40.98% vs -79.53% in Dec 2024
Annual Results Snapshot (Consolidated) - Mar'26
YoY Growth in year ended Mar 2026 is 100.39% vs -74.88% in Mar 2025
YoY Growth in year ended Mar 2026 is 4.49% vs -72.10% in Mar 2025
About Ram Info Ltd

Company Coordinates


