
Compare Captain Polyplas with Similar Stocks
Dashboard
Weak Long Term Fundamental Strength with a 13.97% CAGR growth in Operating Profits over the last 5 years
- Low ability to service debt as the company has a high Debt to EBITDA ratio of 2.03 times
With a growth in Net Profit of 93.55%, the company declared Outstanding results in Mar 26
With ROCE of 14.8, it has a Very Attractive valuation with a 1.9 Enterprise value to Capital Employed
Majority shareholders : Promoters
Consistent Returns over the last 3 years
Stock DNA
Plastic Products - Industrial
INR 439 Cr (Micro Cap)
16.00
36
0.00%
0.46
14.51%
2.32
Total Returns (Price + Dividend) 
Latest dividend: 0.04 per share ex-dividend date: Sep-21-2021
Risk Adjusted Returns v/s
Returns Beta

News
Captain Polyplast Ltd is Rated Hold by MarketsMOJO
Captain Polyplast Ltd is rated 'Hold' by MarketsMOJO, with this rating last updated on 22 May 2026. While the rating change occurred on that date, the analysis and financial metrics discussed here reflect the stock's current position as of 16 June 2026, providing investors with an up-to-date view of the company’s fundamentals, valuation, financial trends, and technical outlook.
Read full news article
Captain Polyplast Ltd is Rated Hold by MarketsMOJO
Captain Polyplast Ltd is rated 'Hold' by MarketsMOJO, with this rating last updated on 22 May 2026. However, the analysis and financial metrics discussed here reflect the stock's current position as of 08 June 2026, providing investors with an up-to-date view of the company’s fundamentals, valuation, financial trends, and technical outlook.
Read full news article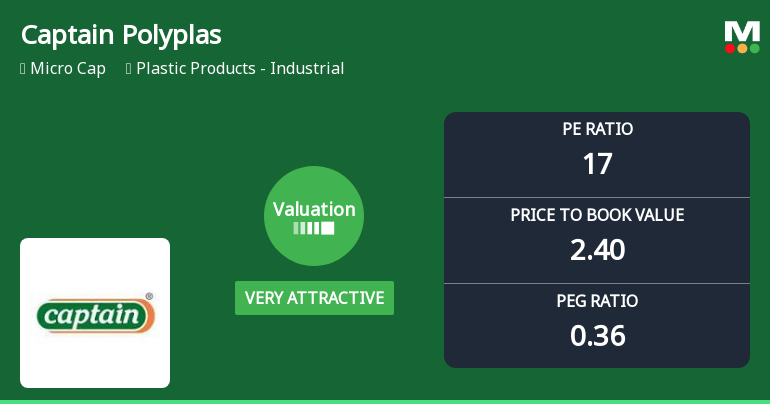
Captain Polyplast Ltd Valuation Shifts to Very Attractive Amid Market Volatility
Captain Polyplast Ltd has seen a significant shift in its valuation parameters, moving from an attractive to a very attractive grade, despite recent market headwinds and a 3.17% decline in its share price. This re-rating reflects improved price-to-earnings and price-to-book value metrics relative to its historical averages and peer group, signalling a potential opportunity for investors seeking value in the plastic products industrial sector.
Read full news article Announcements
Announcement under Regulation 30 (LODR)-Earnings Call Transcript
29-May-2026 | Source : BSEAs attached
Compliances-Reg.24(A)-Annual Secretarial Compliance
28-May-2026 | Source : BSEAnnual secretarial compliance report
Announcement under Regulation 30 (LODR)-Investor Presentation
26-May-2026 | Source : BSEQ-4 RESULT PRESENTATION
Corporate Actions

No Upcoming Board Meetings

Captain Polyplast Ltd has declared 2% dividend, ex-date: 21 Sep 21

Captain Polyplast Ltd has announced 2:10 stock split, ex-date: 19 Sep 18

Captain Polyplast Ltd has announced 1:8 bonus issue, ex-date: 08 Oct 15

No Rights history available
Quality key factors
Valuation key factors
Technicals key factors
 Technical Indicator Scale: Bearish, Mildly Bearish, Sideways, Mildly Bullish, Bullish Turned
 Shareholding Snapshot : Mar 2026
Shareholding Compare (%holding)
Promoters
12.6983
Held by 0 Schemes
Held by 0 FIIs
Rameshbhai Devrajbhai Khichadia (15.42%)
Polymer Impex Private Ltd (1.53%)
26.71%
Quarterly Results Snapshot (Consolidated) - Mar'26 - YoY

YoY Growth in quarter ended Mar 2026 is 80.33% vs 14.08% in Mar 2025
YoY Growth in quarter ended Mar 2026 is 90.62% vs 1.99% in Mar 2025
Half Yearly Results Snapshot (Consolidated) - Sep'25
Growth in half year ended Sep 2025 is 26.51% vs -17.35% in Sep 2024

Growth in half year ended Sep 2025 is -56.16% vs 149.74% in Sep 2024
Nine Monthly Results Snapshot (Consolidated) - Dec'25
YoY Growth in nine months ended Dec 2025 is 32.34% vs -7.61% in Dec 2024
YoY Growth in nine months ended Dec 2025 is -31.25% vs 105.25% in Dec 2024
Annual Results Snapshot (Consolidated) - Mar'26
YoY Growth in year ended Mar 2026 is 45.47% vs -2.54% in Mar 2025
YoY Growth in year ended Mar 2026 is -11.30% vs 76.15% in Mar 2025
About Captain Polyplast Ltd

Company Coordinates


