
Compare Time Technoplast with Similar Stocks
Dashboard
High Management Efficiency with a high ROCE of 15.19%
Strong ability to service debt as the company has a low Debt to EBITDA ratio of 0.82 times
Healthy long term growth as Operating profit has grown by an annual rate 24.59%
The company has declared Positive results for the last 3 consecutive quarters
With ROE of 11.5, it has a Very Attractive valuation with a 2.2 Price to Book Value
High Institutional Holdings at 28.25%
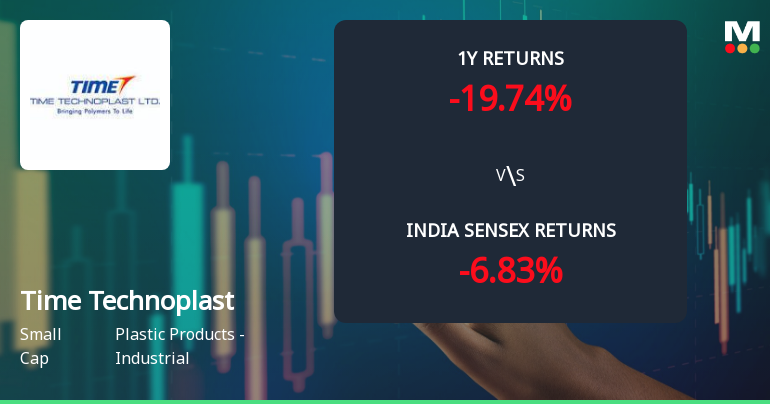
Underperformed the market in the last 1 year
Stock DNA
Plastic Products - Industrial
INR 8,890 Cr (Small Cap)
19.00
36
0.63%
0.04
11.46%
2.20
Total Returns (Price + Dividend) 
Latest dividend: 1.25 per share ex-dividend date: Sep-04-2025
Risk Adjusted Returns v/s
Returns Beta

News
Time Technoplast Ltd. Technical Momentum Shifts Amid Mixed Indicator Signals
Time Technoplast Ltd., a small-cap player in the Plastic Products - Industrial sector, has experienced a notable shift in its technical momentum, moving from a mildly bearish stance to a more sideways trend. This transition is underscored by a complex interplay of technical indicators including MACD, RSI, Bollinger Bands, and moving averages, signalling a nuanced outlook for investors as the stock navigates current market conditions.
Read full news article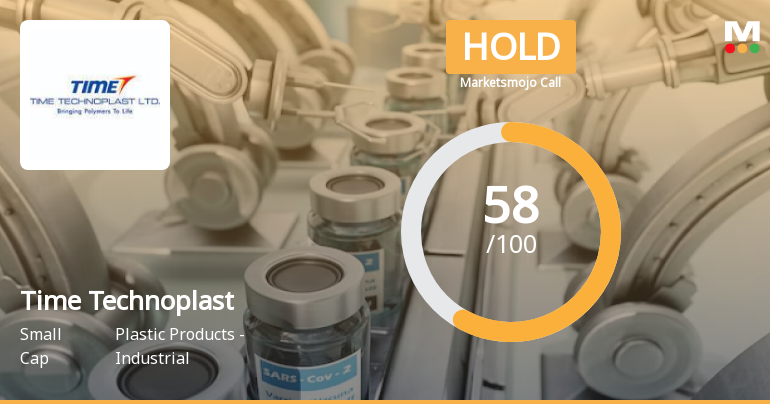
Time Technoplast Ltd. is Rated Hold by MarketsMOJO
Time Technoplast Ltd. is rated 'Hold' by MarketsMOJO, with this rating last updated on 01 Dec 2025. However, the analysis and financial metrics discussed here reflect the stock's current position as of 19 June 2026, providing investors with an up-to-date perspective on the company’s fundamentals, valuation, financial trends, and technical outlook.
Read full news article
Time Technoplast Ltd. is Rated Hold
Time Technoplast Ltd. is rated 'Hold' by MarketsMOJO, with this rating last updated on 01 Dec 2025. However, the analysis and financial metrics discussed here reflect the stock's current position as of 08 June 2026, providing investors with an up-to-date view of the company’s fundamentals, returns, and market standing.
Read full news article Announcements
Intimation of Repayment of Commercial Paper (CP)
25-Jun-2026 | Source : BSEWe hereby certify that the Company has made timely repayment of maturity amount of below mentioned commercial paper in full: Scrip Code: 730854 ISIN No: INE508G14ID1 Maturity Date: 25-06-2026 Date of Repayment: 25-06-2026
Disclosures under Reg. 10(6) of SEBI (SAST) Regulations 2011
24-Jun-2026 | Source : BSEThe Exchange has received the disclosure under Regulation 10(6) of SEBI (Substantial Acquisition of Shares & Takeovers) Regulations 2011 for Time Securities Services Pvt Ltd
Disclosures under Reg. 29(2) of SEBI (SAST) Regulations 2011
24-Jun-2026 | Source : BSEThe Exchange has received the disclosure under Regulation 29(2) of SEBI (Substantial Acquisition of Shares & Takeovers) Regulations 2011 for Naveen Kumar Jain & Others
Corporate Actions

No Upcoming Board Meetings

Time Technoplast Ltd. has declared 250% dividend, ex-date: 04 Sep 25

Time Technoplast Ltd. has announced 1:10 stock split, ex-date: 29 Oct 08

Time Technoplast Ltd. has announced 1:1 bonus issue, ex-date: 23 Sep 25

No Rights history available
Quality key factors
Valuation key factors
Technicals key factors
 Technical Indicator Scale: Bearish, Mildly Bearish, Sideways, Mildly Bullish, Bullish Turned
 Shareholding Snapshot : Mar 2026
Shareholding Compare (%holding)
Promoters
None
Held by 12 Schemes (13.36%)
Held by 149 FIIs (10.88%)
Time Securities Services Private Limited (17.16%)
Hsbc Mutual Fund - Hsbc Small Cap Fund (4.55%)
19.21%
Quarterly Results Snapshot (Consolidated) - Mar'26 - YoY

YoY Growth in quarter ended Mar 2026 is 14.16% vs 5.34% in Mar 2025
YoY Growth in quarter ended Mar 2026 is 20.38% vs 18.59% in Mar 2025
Half Yearly Results Snapshot (Consolidated) - Sep'25

Growth in half year ended Sep 2025 is 10.12% vs 14.38% in Sep 2024
Growth in half year ended Sep 2025 is 18.50% vs 40.46% in Sep 2024
Nine Monthly Results Snapshot (Consolidated) - Dec'25
YoY Growth in nine months ended Dec 2025 is 11.04% vs 10.84% in Dec 2024
YoY Growth in nine months ended Dec 2025 is 20.99% vs 27.67% in Dec 2024
Annual Results Snapshot (Consolidated) - Mar'26
YoY Growth in year ended Mar 2026 is 11.88% vs 9.30% in Mar 2025
YoY Growth in year ended Mar 2026 is 20.82% vs 24.96% in Mar 2025
About Time Technoplast Ltd.

Company Coordinates


