
Compare Pro Fin Capital with Similar Stocks
Dashboard
With a Operating Losses, the company has a Weak Long Term Fundamental Strength
- Poor long term growth as Operating profit has grown by an annual rate of -152.62%
Flat results in Mar 26
Risky - Negative EBITDA
34.14% of Promoter Shares are Pledged
Underperformed the market in the last 1 year
Stock DNA
Diversified Commercial Services
INR 158 Cr (Micro Cap)
NA (Loss Making)
22
0.00%
4.13
-3.83%
2.40
Total Returns (Price + Dividend) 
Latest dividend: 0.0014410499999999997 per share ex-dividend date: Sep-20-2019
Risk Adjusted Returns v/s
Returns Beta

News

Pro Fin Capital Services Ltd is Rated Strong Sell
Pro Fin Capital Services Ltd is rated Strong Sell by MarketsMOJO. This rating was last updated on 01 June 2026, reflecting a significant reassessment of the stock’s outlook. However, all fundamentals, returns, and financial metrics discussed below are current as of 06 July 2026, providing investors with the latest perspective on the company’s position.
Read full news article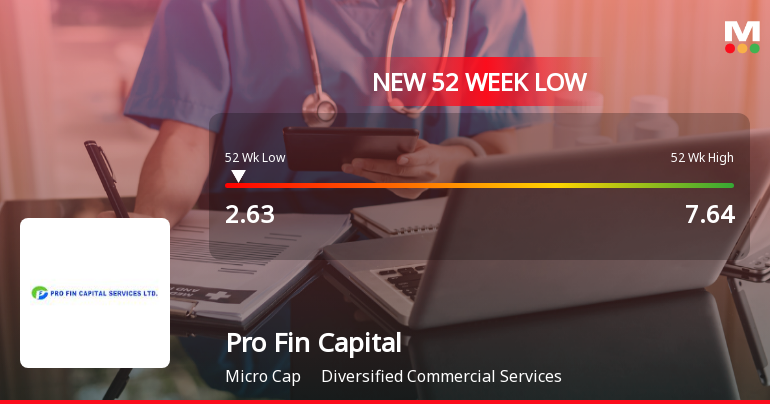
Five Consecutive Losses Push Pro Fin Capital Services Ltd to a New 52-Week Low
For the fifth straight session, Pro Fin Capital Services Ltd closed lower, slipping to a fresh 52-week low of Rs 2.63 on 6 Jul 2026, marking a 33.89% decline over the past year and significantly underperforming the Sensex's 6.39% fall in the same period.
Read full news article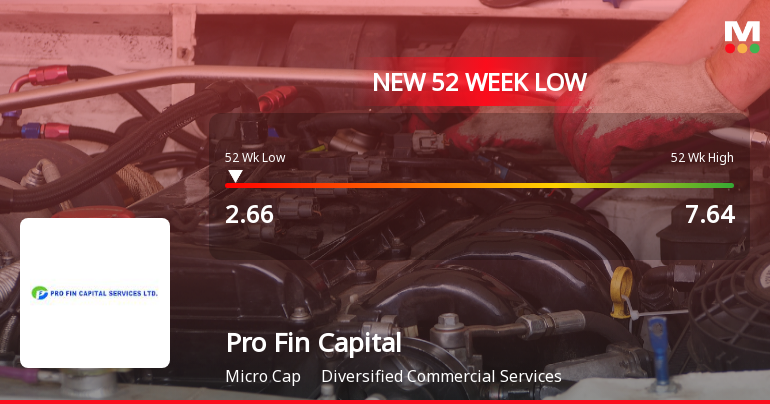
Announcements
Board Meeting Outcome for Increase In Authorized Share Capital Declined
25-Jun-2026 | Source : BSEBoard meeting outcome
Disclosures under Reg. 29(2) of SEBI (SAST) Regulations 2011
25-Jun-2026 | Source : BSEThe Exchange has received the disclosure under Regulation 29(2) of SEBI (Substantial Acquisition of Shares & Takeovers) Regulations 2011 for Ramesh Sawalram Saraogi
Board Meeting Intimation for Increase In Authorised Share Capital
17-Jun-2026 | Source : BSEPro Fin Capital Services Ltdhas informed BSE that the meeting of the Board of Directors of the Company is scheduled on 25/06/2026 inter alia to consider and approve Board meeting Intimation
Corporate Actions

No Upcoming Board Meetings

Pro Fin Capital Services Ltd has declared 1% dividend, ex-date: 20 Sep 19

Pro Fin Capital Services Ltd has announced 1:10 stock split, ex-date: 28 Apr 22

Pro Fin Capital Services Ltd has announced 1:1 bonus issue, ex-date: 02 Jan 26

Pro Fin Capital Services Ltd has announced 1:2 rights issue, ex-date: 31 Dec 24
Quality key factors
Valuation key factors
Technicals key factors
 Technical Indicator Scale: Bearish, Mildly Bearish, Sideways, Mildly Bullish, Bullish Turned
 Shareholding Snapshot : Mar 2026
Shareholding Compare (%holding)
Non Institution
34.141
Held by 0 Schemes
Held by 1 FIIs (0.02%)
Anupam Narain Gupta (2.07%)
Blue Angel Stock Brokers Private Limited (8.8%)
77.01%
Quarterly Results Snapshot (Standalone) - Mar'26 - QoQ

QoQ Growth in quarter ended Mar 2026 is 111.14% vs -228.68% in Dec 2025
QoQ Growth in quarter ended Mar 2026 is 51.80% vs -193.42% in Dec 2025
Half Yearly Results Snapshot (Standalone) - Sep'25

Growth in half year ended Sep 2025 is 13.34% vs 54.19% in Sep 2024
Growth in half year ended Sep 2025 is 320.05% vs 48.05% in Sep 2024
Nine Monthly Results Snapshot (Standalone) - Dec'25
YoY Growth in nine months ended Dec 2025 is -96.85% vs 39.04% in Dec 2024
YoY Growth in nine months ended Dec 2025 is 110.36% vs -1,106.69% in Dec 2024
Annual Results Snapshot (Standalone) - Mar'26
YoY Growth in year ended Mar 2026 is -89.51% vs 14.59% in Mar 2025
YoY Growth in year ended Mar 2026 is -189.04% vs 1,223.08% in Mar 2025
About Pro Fin Capital Services Ltd

Company Coordinates


