
Stock DNA
Computers - Software & Consulting
INR 299,561 Cr (Large Cap)
18.00
20
5.17%
-0.33
23.08%
4.19
Total Returns (Price + Dividend) 
Latest dividend: 24.008979048885934 per share ex-dividend date: Apr-24-2026
Risk Adjusted Returns v/s
Returns Beta

News
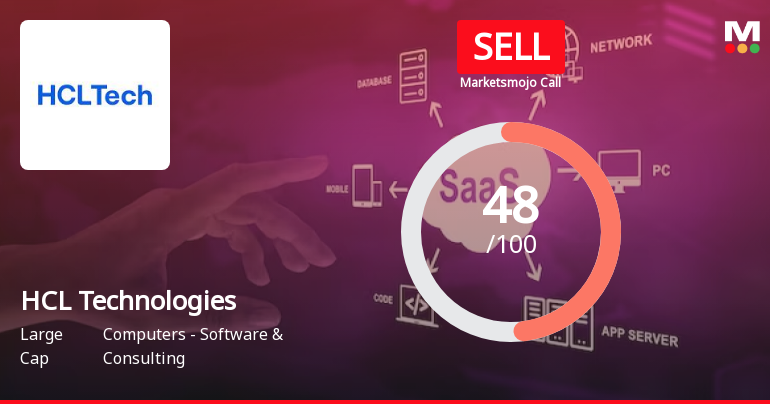
HCL Technologies Ltd is Rated Sell
HCL Technologies Ltd is rated 'Sell' by MarketsMOJO, with this rating last updated on 22 April 2026. However, the analysis and financial metrics discussed here reflect the stock's current position as of 19 June 2026, providing investors with the most recent and relevant data to assess the company’s outlook.
Read full news article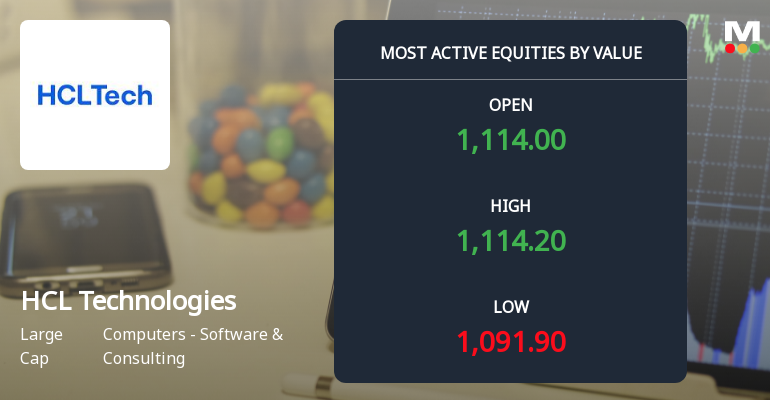
HCL Technologies Sees Heavy Value Trading Amid Declining Momentum
HCL Technologies Ltd, a stalwart in the Computers - Software & Consulting sector, witnessed significant value-based trading activity on 19 June 2026, despite a marked decline in its share price. The stock’s performance reflects a complex interplay of institutional interest, large order flows, and sector-wide pressures, underscoring the challenges faced by this large-cap IT giant amid a broader market downturn.
Read full news article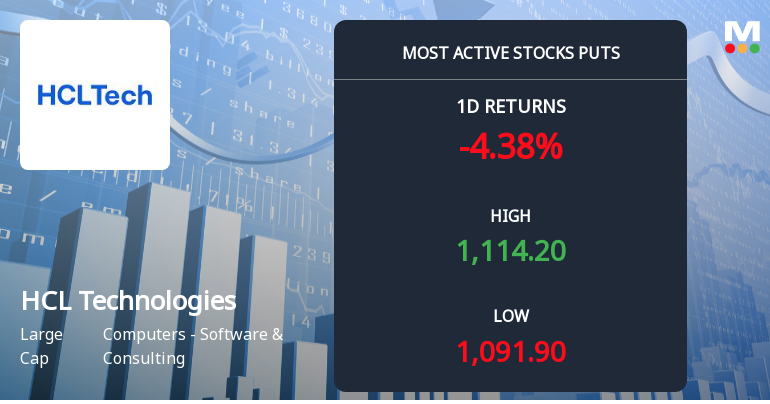
Rs 1,100 Puts — Just Below Current Price — Draw 3,318 Contracts on HCL Technologies Ltd
The stock is trading near its 52-week low at Rs 1,104.20, with 3,318 put contracts at the Rs 1,100 strike exchanging hands on 19 Jun 2026. This concentrated put activity, close to the current price, raises questions about whether investors are positioning for further downside or seeking protection amid recent weakness.
Read full news article Announcements
Release - Hcltech Recognized As A Market Shaper In The 2026 Gartner® Emerging Market Quadrant For Physical AI Services - Established Vendors
18-Jun-2026 | Source : BSEEnclosed please find a release on the captioned subject being issued by the Company today.
Release - Hcltech Launches AI Innovation Zone Featuring Intel-Powered Enterprise Solutions
18-Jun-2026 | Source : BSEEnclosed please find a release on the captioned subject being issued by the Company today.
Release - Volkswagen GroupS E.Solutions Selects Hcltech To Accelerate Innovation For Next-Generation Automotive Infotainment And Connectivity Solutions
17-Jun-2026 | Source : BSEEnclosed please find a release on the captioned subject issued by the Company today.
Corporate Actions

13 Jul 2026

HCL Technologies Ltd has declared 1200% dividend, ex-date: 24 Apr 26

No Splits history available

HCL Technologies Ltd has announced 1:1 bonus issue, ex-date: 05 Dec 19

No Rights history available
Quality key factors
Valuation key factors
Technicals key factors
 Technical Indicator Scale: Bearish, Mildly Bearish, Sideways, Mildly Bullish, Bullish Turned
 Shareholding Snapshot : Mar 2026
Shareholding Compare (%holding)
Promoters
None
Held by 50 Schemes (9.22%)
Held by 1166 FIIs (15.51%)
Vama Sundari Investments (delhi) Pvt. Ltd. (44.21%)
Life Insurance Corporation Of India (6.97%)
3.12%
Quarterly Results Snapshot (Consolidated) - Mar'26 - YoY

YoY Growth in quarter ended Mar 2026 is 12.35% vs 6.13% in Mar 2025

YoY Growth in quarter ended Mar 2026 is 4.20% vs 8.05% in Mar 2025
Half Yearly Results Snapshot (Consolidated) - Sep'25
Growth in half year ended Sep 2025 is 9.44% vs 7.46% in Sep 2024
Growth in half year ended Sep 2025 is -4.88% vs 15.29% in Sep 2024
Nine Monthly Results Snapshot (Consolidated) - Dec'25
YoY Growth in nine months ended Dec 2025 is 10.78% vs 6.63% in Dec 2024
YoY Growth in nine months ended Dec 2025 is -7.10% vs 11.67% in Dec 2024
Annual Results Snapshot (Consolidated) - Mar'26
YoY Growth in year ended Mar 2026 is 11.18% vs 6.50% in Mar 2025
YoY Growth in year ended Mar 2026 is -4.30% vs 10.75% in Mar 2025
About HCL Technologies Ltd

Company Coordinates


