
Compare TCS with Similar Stocks
Dashboard
Strong Long Term Fundamental Strength with an average Return on Equity (ROE) of 48.29%
- Healthy long term growth as Net Sales has grown by an annual rate of 10.22%
- The company is Net-Debt Free
Flat results in Mar 26
With ROE of 49.1, it has a Attractive valuation with a 7.2 Price to Book Value
High Institutional Holdings at 23.08%
Consistent Underperformance against the benchmark over the last 3 years
Stock DNA
Computers - Software & Consulting
INR 774,434 Cr (Large Cap)
15.00
20
3.72%
-0.33
49.09%
7.17
Total Returns (Price + Dividend) 
Latest dividend: 11 per share ex-dividend date: Jan-16-2026
Risk Adjusted Returns v/s
Returns Beta

News
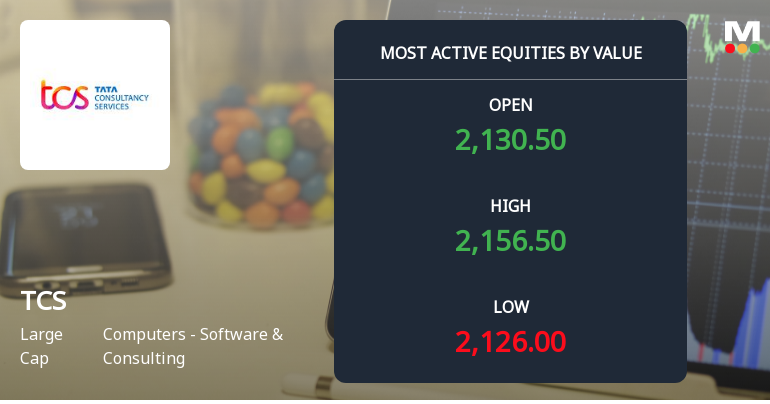
Tata Consultancy Services Ltd. Sees High Value Trading Amid Institutional Interest
Tata Consultancy Services Ltd. (TCS), a stalwart in the Computers - Software & Consulting sector, witnessed significant trading activity on 22 June 2026, driven by robust institutional participation and high-value turnover. The stock demonstrated a modest gain, reflecting renewed investor confidence following a brief correction phase.
Read full news article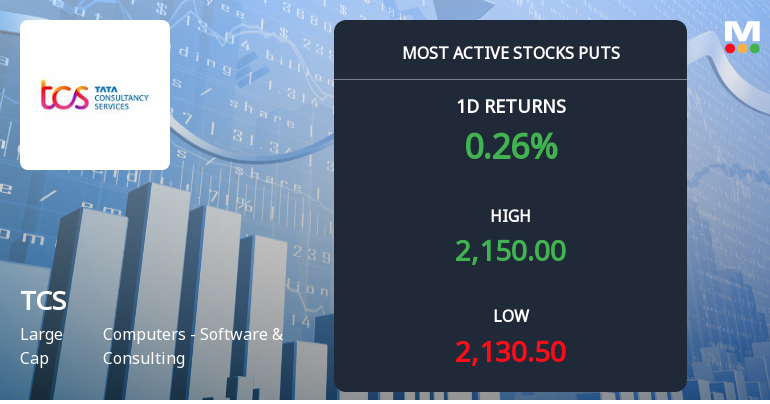
Rs 2,100 Puts Draw 3,866 Contracts on Tata Consultancy Services Ltd. Ahead of 30 June Expiry
The Rs 2,100 put strike on Tata Consultancy Services Ltd. (TCS) attracted 3,866 contracts on 22 June 2026, signalling notable activity just 8 days before expiry. With the stock trading marginally above this level at Rs 2,133.20, the options data invites a closer look at whether this reflects hedging, bearish positioning, or put writing.
Read full news article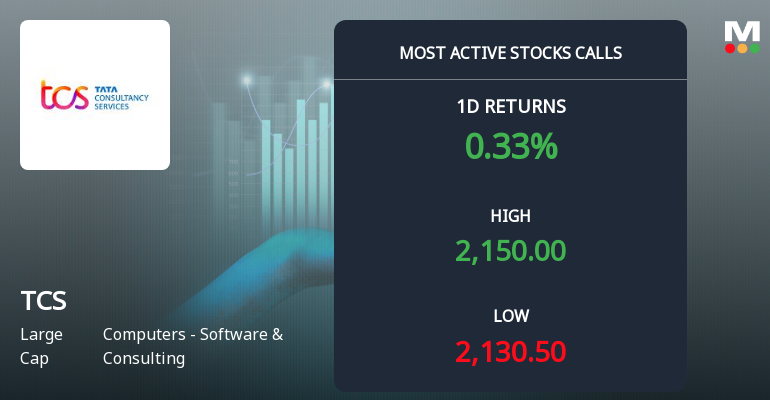
10,546 Call Contracts at Rs 2,200 Strike on Tata Consultancy Services Ltd. Signal Speculative Upside Ahead of 30-Jun Expiry
On 22 Jun 2026, 10,546 call contracts at the Rs 2,200 strike price changed hands on Tata Consultancy Services Ltd. (TCS), with the stock closing at Rs 2,133.80. This surge in call activity, concentrated near the upper end of the strike spectrum, suggests a speculative directional bet on upside momentum ahead of the 30-Jun expiry.
Read full news article Announcements
Press Release - TCS Wins Multi-Year Deal To Transform Elopaks IT Operations
17-Jun-2026 | Source : BSETCS wins multi-year deal to transform Elopaks IT Operations
Press Release - Tottenham Hotspur Announces TCS As Digital Transformation Partner
16-Jun-2026 | Source : BSEPress Release - Tottenham Hotspur announces TCS as Digital Transformation Partner
Disclosure Under Regulation 30 Of The SEBI (Listing Obligations And Disclosure Requirements) Regulations 2015
16-Jun-2026 | Source : BSEDisclosure under Regulation 30 of the SEBI (LODR) Regulations 2015
Corporate Actions

No Upcoming Board Meetings

Tata Consultancy Services Ltd. has declared 1100% dividend, ex-date: 16 Jan 26

No Splits history available

Tata Consultancy Services Ltd. has announced 1:1 bonus issue, ex-date: 31 May 18

No Rights history available
Quality key factors
Valuation key factors
Technicals key factors
 Technical Indicator Scale: Bearish, Mildly Bearish, Sideways, Mildly Bullish, Bullish Turned
 Shareholding Snapshot : Mar 2026
Shareholding Compare (%holding)
Promoters
None
Held by 45 Schemes (5.77%)
Held by 1242 FIIs (9.66%)
Tata Sons Private Limited (71.74%)
Lic Of India (5.52%)
4.52%
Quarterly Results Snapshot (Consolidated) - Mar'26 - QoQ

QoQ Growth in quarter ended Mar 2026 is 5.38% vs 1.96% in Dec 2025
QoQ Growth in quarter ended Mar 2026 is 28.72% vs -11.74% in Dec 2025
Half Yearly Results Snapshot (Consolidated) - Sep'25

Growth in half year ended Sep 2025 is 1.86% vs 6.55% in Sep 2024
Growth in half year ended Sep 2025 is 3.70% vs 6.84% in Sep 2024
Nine Monthly Results Snapshot (Consolidated) - Dec'25
YoY Growth in nine months ended Dec 2025 is 2.87% vs 6.23% in Dec 2024
YoY Growth in nine months ended Dec 2025 is -2.30% vs 8.53% in Dec 2024
Annual Results Snapshot (Consolidated) - Mar'26
YoY Growth in year ended Mar 2026 is 4.58% vs 5.99% in Mar 2025
YoY Growth in year ended Mar 2026 is 1.35% vs 5.76% in Mar 2025
About Tata Consultancy Services Ltd.

Company Coordinates


