IndiaNivesh

  • Market Cap: Micro Cap
  • Industry: Non Banking Financial Company (NBFC)
  • ISIN: INE131H01028
  • NSEID:
  • BSEID: 501700
INR
7.24
-0.06 (-0.82%)
BSENSE

Jul 13, 10:34 AM

BSE+NSE Vol: 2.33 k

  • Price Points
  • Score
  • Mojo Parameters
  • Total Return
  • News and Corporate Actions
  • Key factors
  • Shareholding
  • Financials
  • CompanyCV
stock-summaryPrice Point
High/Low

1Day

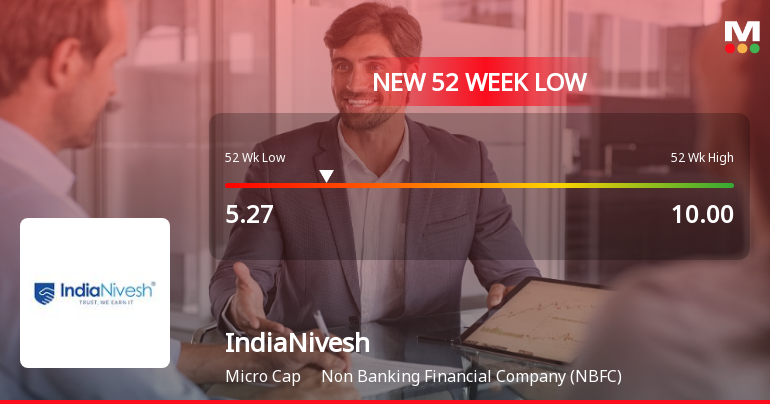
52 Week

Valuation
Technical
Day's Volume

CASH

2.33 k (305.90%) Volume

Shareholding (Mar 2026)

FII

0.00%

Held by 0 FIIs

DII

0.89%

Held by 0 DIIs

Promoter

62.45%

Why is IndiaNivesh Ltd falling/rising?

12-Jul-2026

As of 12-Jul, IndiaNivesh Ltd's stock price is rising to 7.30, reflecting a 7.83% increase due to strong relative performance and increased investor participation. Despite longer-term declines, the current positive movement suggests a favorable short-term outlook.

As of 12-Jul, IndiaNivesh Ltd's stock price is rising, currently at 7.30, reflecting a change of 0.53 or 7.83% increase. This upward movement can be attributed to several factors. Notably, the stock has outperformed its sector by 6.27% today, indicating a strong relative performance. Additionally, there has been a trend reversal as the stock gained after three consecutive days of decline, suggesting a potential shift in investor sentiment.<BR><BR>Moreover, there is rising investor participation, evidenced by a significant increase in delivery volume, which rose by 115.08% compared to the 5-day average. This increase in trading activity may indicate growing interest and confidence among investors in the stock. <BR><BR>While the stock has shown negative performance over longer periods, such as a year-to-date decline of 8.18% and a one-year drop of 22.34%, the current positive movement and increased liquidity, with a delivery volume of 12.07 k, suggest a favorable short-term outlook. Overall, these factors contribute to the stock's rise on this particular day.

View full answer

How big is IndiaNivesh?

11-Jun-2026

As of 10th June, IndiaNivesh Ltd has a market capitalization of 29.00 Cr, with recent net sales of 1.95 Cr and a net loss of 9.01 Cr over the last four quarters. The balance sheet shows shareholder's funds at a loss of 40.50 Cr and total assets of 86.98 Cr.

As of 10th June, <BR><BR>Market Cap: IndiaNivesh Ltd has a market capitalization of 29.00 Cr, categorizing it as a Micro Cap company.<BR><BR>Recent Quarterly Performance: The sum of Net Sales for the latest 4 quarters is 1.95 Cr, while the sum of Net Profit for the same period reflects a loss of 9.01 Cr.<BR><BR>Balance Sheet Snapshot: The reporting period for the balance sheet is March 2025, with Shareholder's Funds amounting to a loss of 40.50 Cr and Total Assets valued at 86.98 Cr.

View full answer

Who are in the management team of IndiaNivesh?

11-Jun-2026

The management team of IndiaNivesh includes Dinesh Nuwal (Promoter & Non-Executive Director), Rajesh Nuwal (Managing Director & CFO), Hemant Panpalia (Promoter & Non-Executive Director), Tilak Raj Bajalia and R R Baldi (Independent Non-Executive Directors), Sona Parag Hadkar (Non-Executive Director), and Jinesh Doshi (Company Secretary).

The management team of IndiaNivesh includes the following members:<BR><BR>1. **Dinesh Nuwal** - Promoter & Non-Executive Director<BR>2. **Rajesh Nuwal** - Managing Director & Chief Financial Officer<BR>3. **Hemant Panpalia** - Promoter & Non-Executive Director<BR>4. **Tilak Raj Bajalia** - Independent Non-Executive Director<BR>5. **R R Baldi** - Independent Non-Executive Director<BR>6. **Sona Parag Hadkar** - Non-Executive Director<BR>7. **Jinesh Doshi** - Company Secretary<BR><BR>If you need more details about any specific member or their roles, feel free to ask!

View full answer

Who are the peers of the IndiaNivesh?

11-Jun-2026

IndiaNivesh's peers include Williamson Magor, Margo Finance, Shricon Indus., TCFC Finance, Amrapali Fincap, Challani Capital, Intec Capital, Ramsons Projects, and Sulabh Engineers. While IndiaNivesh shows excellent growth and capital structure, its 1-year return is -33.82%, lower than Williamson Magor's -29.21%.

Peers: The peers of IndiaNivesh are Williamson Magor, Margo Finance, Shricon Indus., TCFC Finance, Amrapali Fincap, Challani Capital, Intec Capital, Ramsons Projects, and Sulabh Engineers.<BR><BR>Quality Snapshot: Excellent management risk is observed at Margo Finance, Shricon Indus., TCFC Finance, Amrapali Fincap, Challani Capital, Intec Capital, Ramsons Projects, and Sulabh Engineers, while Below Average management risk is found at Williamson Magor and the rest. Growth is Excellent at IndiaNivesh, Amrapali Fincap, and Ramsons Projects, while Average growth is noted at Margo Finance and Challani Capital, and the rest show Below Average growth. Excellent capital structure is seen at Margo Finance, Shricon Indus., TCFC Finance, Amrapali Fincap, Challani Capital, Intec Capital, IndiaNivesh, Ramsons Projects, and Sulabh Engineers, while Williamson Magor does not qualify.<BR><BR>Return Snapshot: The peer with the highest 1-year return is R G F Capital at 305.45%, while Williamson Magor has the lowest at -29.21%. IndiaNivesh’s 1-year return is -33.82%, which is lower than Williamson Magor's. Additionally, the six-month return is negative for Williamson Magor, TCFC Finance, Intec Capital, and Ramsons Projects.

View full answer

What does IndiaNivesh do?

10-Jun-2026

IndiaNivesh Ltd is a micro-cap Non-Banking Financial Company (NBFC) involved in investing, financing, and managing stressed assets, as well as providing consultancy services. As of March 2026, it reported net sales of 0 Cr and a net profit of -11 Cr, with a market cap of INR 29 Cr.

Overview:<BR>IndiaNivesh Ltd is a Non Banking Financial Company (NBFC) in the micro cap category, engaged in investing and financing activities, acquisition and management of stressed assets, and providing consultancy services.<BR><BR>History:<BR>IndiaNivesh Limited was incorporated in May 1931. The latest quarterly results reported net sales and net profit for the period ending March 2026.<BR><BR>Financial Snapshot:<BR>Most recent Net Sales: 0 Cr (Quarterly Results - Mar 2026) <BR>Most recent Net Profit: -11 Cr (Quarterly Results - Mar 2026) <BR>Market-cap value: INR 29 Cr (Micro Cap)<BR><BR>Key Metrics:<BR>P/E: N/A <BR>Industry P/E: 20 <BR>Dividend Yield: 0.00% <BR>Debt-Equity: -2.84 <BR>Return on Equity: 18.19% <BR>Price to Book: -0.58<BR><BR>Contact Details:<BR>Address: 1703 17th Floor Lodha Supremus, Senapati Bapat Marg Lower Parel Mumbai Maharashtra : 400013 <BR>Email: investorrelations@indianivesh.in <BR>Website: http://www.indianivesh.in

View full answer

Should I buy, sell or hold IndiaNivesh Ltd?

03-Jun-2026

Are IndiaNivesh Ltd latest results good or bad?

02-Jun-2026

IndiaNivesh Ltd's latest results are very poor, with a net loss of ₹10.85 crores and a 96.76% drop in revenue compared to the previous quarter, indicating significant financial distress and raising concerns about the company's viability.

IndiaNivesh Ltd's latest results for Q4 FY26 indicate a troubling financial situation. The company reported a net loss of ₹10.85 crores, which represents a staggering 696.15% decline compared to the previous quarter. Revenue also plummeted to just ₹0.06 crores, marking a 96.76% decrease quarter-on-quarter and a 60% decline year-on-year. <BR><BR>The operating margin has deteriorated significantly, with an operating margin of -1816.67%, showcasing a severe misalignment between costs and revenue. Additionally, interest expenses surged to ₹9.06 crores, up an astronomical 30,100% from the previous quarter, further exacerbating the company's financial distress.<BR><BR>Overall, the results reflect a company in crisis, grappling with collapsing revenues, mounting losses, and a negative net worth of ₹40.50 crores. Given these factors, the latest results can be characterized as very poor, raising serious concerns about the company's viability moving forward.

View full answer

When is the next results date for IndiaNivesh Ltd?

26-May-2026

The next results date for IndiaNivesh Ltd is 29 May 2026.

The next results date for IndiaNivesh Ltd is scheduled for 29 May 2026.

View full answer

Is IndiaNivesh overvalued or undervalued?

05-Dec-2025

As of December 4, 2025, IndiaNivesh's valuation has improved to attractive, yet it remains undervalued with a PE ratio of -2.84 and a year-to-date return of -48.55%, significantly lagging behind peers and the Sensex.

As of 4 December 2025, the valuation grade for IndiaNivesh has moved from risky to attractive, indicating a significant improvement in its perceived value. Despite this positive change, the company appears to be undervalued based on its financial ratios. Key metrics include a PE ratio of -2.84, an EV to EBITDA of -123.74, and a ROCE of -1.93%. These figures suggest that the company is struggling to generate profits relative to its valuation.<BR><BR>When compared to peers, IndiaNivesh stands out with a notably low PE ratio of -2.84, while Bajaj Finance has a PE of 34.9, indicating a stark contrast in valuation. Life Insurance, another peer, shows a more attractive PE of 10.85, further emphasizing IndiaNivesh's undervaluation. Additionally, the company's performance has lagged significantly behind the Sensex, with a year-to-date return of -48.55% compared to the Sensex's 9.12%, reinforcing the notion that the stock may be undervalued in the current market context.

View full answer

How has been the historical performance of IndiaNivesh?

14-Nov-2025

IndiaNivesh has experienced significant fluctuations in financial performance, with net sales declining from 318.06 crore in March 2019 to 3.99 crore in March 2025, and ongoing challenges reflected in negative profits and cash flow. Despite a brief profit in March 2025, the overall trend indicates volatility and financial instability.

Answer:<BR>The historical performance of IndiaNivesh shows significant fluctuations in its financial metrics over the years.<BR><BR>Breakdown:<BR>IndiaNivesh's net sales have seen a dramatic decline from 318.06 crore in March 2019 to just 3.99 crore in March 2025, with a notable peak of 119.03 crore in March 2020. The total operating income followed a similar trend, dropping from 318.06 crore in March 2019 to 3.99 crore in March 2025. The company's total expenditure, excluding depreciation, decreased from 285.21 crore in March 2019 to 1.80 crore in March 2025. Operating profit (PBDIT) fluctuated significantly, with a loss of 5.02 crore in March 2023 turning into a profit of 4.73 crore in March 2025. However, the profit before tax remained negative at -5.72 crore in March 2025, reflecting ongoing challenges. The profit after tax also showed a loss of -6.39 crore in March 2025, compared to a profit of 2.53 crore in March 2024. The company's total liabilities have been relatively stable, increasing slightly from 83.28 crore in March 2023 to 86.98 crore in March 2025. Cash flow from operating activities has been negative, with -10.00 crore reported in March 2025, indicating ongoing cash flow challenges. Overall, IndiaNivesh's financial performance has been marked by significant volatility, particularly in sales and profitability metrics.

View full answer

Who are the top shareholders of the IndiaNivesh?

17-Jul-2025

The top shareholders of IndiaNivesh include Sneh Shares And Securities Private Limited with 44.38%, Bright Impex & Agencies Private Limited with 13.1%, and individual investors holding 15.11%. There are no mutual funds or foreign institutional investors currently holding shares in the company.

The top shareholders of IndiaNivesh include the promoters, who hold the majority of the shares. The promoter with the highest holding is Sneh Shares And Securities Private Limited, which owns 44.38% of the company. Additionally, Bright Impex & Agencies Private Limited is the highest public shareholder, holding 13.1%. Individual investors collectively hold 15.11% of the shares. It's worth noting that there are currently no mutual funds or foreign institutional investors (FIIs) holding shares in the company.

View full answer

What is the technical trend for IndiaNivesh?

09-Jun-2025

As of May 16, 2025, IndiaNivesh's trend is mildly bearish due to conflicting signals from moving averages and Bollinger Bands, despite mildly bullish indicators from the MACD and KST.

As of 16 May 2025, the technical trend for IndiaNivesh has changed from bearish to mildly bearish. The weekly MACD and KST indicate a mildly bullish stance, while the monthly MACD and KST also support this view. However, the Bollinger Bands and daily moving averages are bearish, which adds downward pressure. The RSI shows no signal on both weekly and monthly time frames, indicating a lack of momentum. Overall, the current stance is mildly bearish, driven primarily by the conflicting signals from moving averages and Bollinger Bands against the mildly bullish indicators from MACD and KST.

View full answer

Has IndiaNivesh declared dividend?

06-Jun-2025

IndiaNivesh Ltd has declared a 10% dividend, amounting to 0.1 per share, with an ex-date of September 19, 2018. However, total returns over various periods have been negative, indicating a decline in stock performance despite the dividend announcement.

IndiaNivesh Ltd has declared a 10% dividend.<BR><BR>Dividend Details:<BR>- Percentage announced: 10%<BR>- Amount per share: 0.1<BR>- Ex-date: 19 Sep 18<BR><BR>Dividend Yield: 0%<BR><BR>Total Returns by Period:<BR>Over the 6-month period, the price return was -26.81%, the dividend return was 0%, resulting in a total return of -26.81%.<BR><BR>In the 1-year period, the price return was -12.0%, the dividend return was 0%, leading to a total return of -12.0%.<BR><BR>For the 2-year period, the price return was -78.0%, the dividend return was 0%, which resulted in a total return of -78.0%.<BR><BR>During the 3-year period, the price return was -82.53%, the dividend return was 0%, culminating in a total return of -82.53%.<BR><BR>In the 4-year period, the price return was -35.67%, the dividend return was 0%, giving a total return of -35.67%.<BR><BR>Over the 5-year period, the price return was -57.36%, the dividend return was 0%, resulting in a total return of -57.36%.<BR><BR>Overall, while IndiaNivesh has declared a dividend, the total returns across various periods have been negative, indicating a decline in the company's stock performance despite the dividend announcement. The lack of dividend yield further suggests that the dividend has not significantly contributed to shareholder returns.

View full answer
iScoreScore
Click here to find our call on this stock
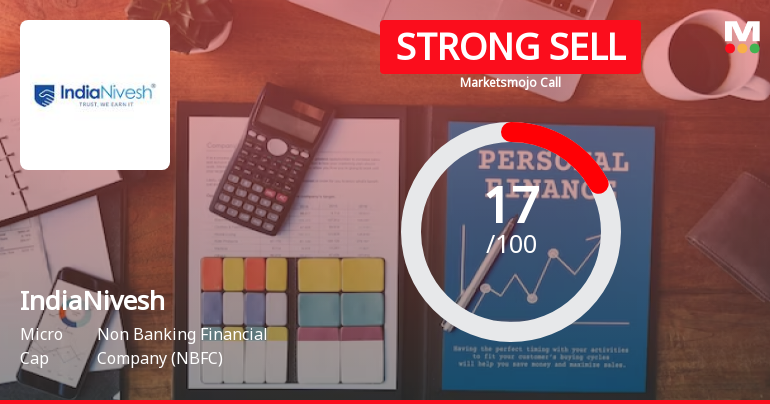
Strong Sell
Sell
Hold
Buy
Strong Buy

Dashboard

1

With a Negative Book Value, the company has a Weak Long Term Fundamental Strength

 
2

Flat results in Mar 26

3

Risky - Negative Book Value

4

Consistent Underperformance against the benchmark over the last 3 years

stock-summaryMojo Parameters

Mojo Parameters

Loading Valuation Snapshot...

Stock DNA

stock-summary
Industry

Non Banking Financial Company (NBFC)

stock-summary
Market cap

INR 28 Cr (Micro Cap)

stock-summary
P/E

NA (Loss Making)

stock-summary
Industry P/E

22

stock-summary
Dividend Yield

0.00%

stock-summary
Debt Equity

-2.84

stock-summary
Return on Equity

18.19%

stock-summary
Price to Book

-0.56

Revenue and Profits:
Net Sales:
0 Cr
(Quarterly Results - Mar 2026)
Net Profit:
-11 Cr
stock-summaryTotal Returns
Total Returns (Price + Dividend) stock-summary
Dividend Yield (0%)
TimePeriod
Price Return
Dividend Return
Total Return
3 Months
-7.06%
0%
-7.06%
6 Months
-8.93%
0%
-8.93%
1 Year
-23.71%
0%
-23.71%
2 Years
-51.51%
0%
-51.51%
3 Years
-84.55%
0%
-84.55%
4 Years
-91.19%
0%
-91.19%
5 Years
-57.78%
0%
-57.78%

Latest dividend: 0.1 per share ex-dividend date: Sep-19-2018

Risk Adjusted Returns v/s stock-summary
Returns Beta
Icon
Beta has not been calculated since enough price history is not available
stock-summaryNews & Corporate Actions

News

Announcements stock-summary

Closure of Trading Window

29-Jun-2026 | Source : BSE

We hereby submit the intimation towards the closure of trading of window for the quarter ended 30th June 2026

Announcement under Regulation 30 (LODR)-Newspaper Publication

01-Jun-2026 | Source : BSE

Regulation 30 and 47(3) of SEBI (LODR) regulation 2015 in Relation to Financial Result of Financial Year ended 31st March 2026

Board Meeting Outcome for Pursuant To The Regulation 30 And 33 Of The SEBI (Listing Obligation And Disclosure Requirement) Regulation 2015 This Is To Inform The Exchange The Board Of Directors At Their Meeting Held On Friday 29Th May 2026

29-May-2026 | Source : BSE

Pursuant to the Regulation 30 and 33 of the SEBI (Listing Obligation and Disclosure Requirement) Regulation 2015 this is to inform the Exchange the Board of Directors at their Meeting held on Friday 29th May 2026

Corporate Actions stock-summary

stock-summary
BOARD MEETING

No Upcoming Board Meetings

stock-summary
DIVIDEND

IndiaNivesh Ltd has declared 10% dividend, ex-date: 19 Sep 18

stock-summary
SPLITS

IndiaNivesh Ltd has announced 1:10 stock split, ex-date: 18 Apr 12

stock-summary
BONUS

No Bonus history available

stock-summary
RIGHTS

No Rights history available

stock-summaryKey Factors

Quality key factors stock-summary

Factor
Value
Sales Growth (5y)
-25.58%
EBIT Growth (5y)
-25.59%
Net Debt to Equity (avg)
-2.84
Institutional Holding
0.89%
ROE (avg)
6.61%

Valuation key factors

Factor
Value
P/E Ratio
NA (Loss Making)
Industry P/E
22
Price to Book Value
-0.56
EV to EBIT
-150.72
EV to EBITDA
-167.30
EV to Capital Employed
1.85
EV to Sales
85.79
PEG Ratio
NA
Dividend Yield
NA
ROCE (Latest)
-1.23%
ROE (Latest)
Negative BV

Technicals key factors

Indicator
Weekly
Monthly
MACD
Bearish
Mildly Bullish
RSI
No Signal
No Signal
Bollinger Bands
Mildly Bearish
Mildly Bearish
Moving Averages
Bearish (Daily)
KST
Bearish
Mildly Bullish
Dow Theory
Mildly Bearish
Mildly Bearish
stock-summary Technical Indicator Scale: Bearish, Mildly Bearish, Sideways, Mildly Bullish, Bullish  Turned 
stock-summaryShareholding
Shareholding Snapshot : Mar 2026stock-summary
Shareholding Compare (%holding) stock-summary
Majority shareholders

Promoters

Pledged Promoter Holdings

None

Mutual Funds

Held by 0 Schemes

FIIs

Held by 0 FIIs

Promoter with highest holding

Sneh Shares & Securities Private Limited (44.38%)

Highest Public shareholder

Bright Impex & Agencies Private Limited (8.83%)

Individual Investors Holdings

16.3%

stock-summaryFinancial
[
  {
    "link": "quarterly",
    "btn_text": "All Quarterly Results",
    "header": "Quarterly Results Snapshot (Consolidated) - Mar'26 - YoY",
    "rhs": [
      {
        "prefix": "Net Sales ",
        "suffix": "YoY Growth in quarter ended Mar 2026 is -60.00% vs -71.15% in Mar 2025",
        "dir": 1
      },
      {
        "prefix": "Consolidated Net Profit ",
        "suffix": "YoY Growth in quarter ended Mar 2026 is -1.78% vs -367.54% in Mar 2025",
        "dir": 1
      }
    ],
    "table": {
      "header": [
        "Mar'26",
        "Mar'25",
        "Change(%)"
      ],
      "body": [
        {
          "field": "Net Sales",
          "val1": "0.06",
          "val2": "0.15",
          "chgp": "-60.00%",
          "chgp_class": "negative"
        },
        {
          "field": "Operating Profit (PBDIT) excl Other Income",
          "val1": "-1.09",
          "val2": "-0.50",
          "chgp": "-118.00%",
          "chgp_class": "negative"
        },
        {
          "field": "Interest",
          "val1": "9.06",
          "val2": "9.85",
          "chgp": "-8.02%",
          "chgp_class": "positive"
        },
        {
          "field": "Exceptional Items",
          "val1": "0.00",
          "val2": "0.00",
          "chgp": "",
          "chgp_class": "neutral"
        },
        {
          "field": "Consolidate Net Profit",
          "val1": "-10.85",
          "val2": "-10.66",
          "chgp": "-1.78%",
          "chgp_class": "negative"
        },
        {
          "field": "Operating Profit Margin (Excl OI)",
          "val1": "-1,816.67%",
          "val2": "-333.33%",
          "chgp": "-1,483.34%",
          "chgp_class": "negative"
        }
      ]
    }
  },
  {
    "link": "half-yearly",
    "btn_text": "All Half Yearly Results",
    "header": "Half Yearly Results Snapshot (Consolidated) - Sep'25",
    "rhs": [
      {
        "prefix": "Net Sales ",
        "suffix": " Growth in half year ended Sep 2025 is -98.80% vs 4.39% in Sep 2024",
        "dir": -1
      },
      {
        "prefix": "Consolidated Net Profit ",
        "suffix": " Growth in half year ended Sep 2025 is -99.44% vs 25.35% in Sep 2024",
        "dir": -1
      }
    ],
    "table": {
      "header": [
        "Sep'25",
        "Sep'24",
        "Change(%)"
      ],
      "body": [
        {
          "field": "Net Sales",
          "val1": "0.04",
          "val2": "3.33",
          "chgp": "-98.80%",
          "chgp_class": "negative"
        },
        {
          "field": "Operating Profit (PBDIT) excl Other Income",
          "val1": "-0.88",
          "val2": "2.47",
          "chgp": "-135.63%",
          "chgp_class": "negative"
        },
        {
          "field": "Interest",
          "val1": "0.24",
          "val2": "0.05",
          "chgp": "380.00%",
          "chgp_class": "negative"
        },
        {
          "field": "Exceptional Items",
          "val1": "0.00",
          "val2": "0.00",
          "chgp": "",
          "chgp_class": "neutral"
        },
        {
          "field": "Consolidate Net Profit",
          "val1": "0.02",
          "val2": "3.56",
          "chgp": "-99.44%",
          "chgp_class": "negative"
        },
        {
          "field": "Operating Profit Margin (Excl OI)",
          "val1": "-2,200.00%",
          "val2": "74.17%",
          "chgp": "-2,274.17%",
          "chgp_class": "negative"
        }
      ]
    }
  },
  {
    "link": "nine-monthly",
    "btn_text": "All Nine Monthly Results",
    "header": "Nine Monthly Results Snapshot (Consolidated) - Dec'25",
    "rhs": [
      {
        "prefix": "Net Sales ",
        "suffix": "YoY Growth in nine months ended Dec 2025 is -50.78% vs -31.55% in Dec 2024",
        "dir": -1
      },
      {
        "prefix": "Consolidated Net Profit ",
        "suffix": "YoY Growth in nine months ended Dec 2025 is -56.91% vs -11.23% in Dec 2024",
        "dir": -1
      }
    ],
    "table": {
      "header": [
        "Dec'25",
        "Dec'24",
        "Change(%)"
      ],
      "body": [
        {
          "field": "Net Sales",
          "val1": "1.89",
          "val2": "3.84",
          "chgp": "-50.78%",
          "chgp_class": "negative"
        },
        {
          "field": "Operating Profit (PBDIT) excl Other Income",
          "val1": "0.39",
          "val2": "2.56",
          "chgp": "-84.77%",
          "chgp_class": "negative"
        },
        {
          "field": "Interest",
          "val1": "0.27",
          "val2": "0.06",
          "chgp": "350.00%",
          "chgp_class": "negative"
        },
        {
          "field": "Exceptional Items",
          "val1": "0.00",
          "val2": "0.00",
          "chgp": "",
          "chgp_class": "neutral"
        },
        {
          "field": "Consolidate Net Profit",
          "val1": "1.84",
          "val2": "4.27",
          "chgp": "-56.91%",
          "chgp_class": "negative"
        },
        {
          "field": "Operating Profit Margin (Excl OI)",
          "val1": "20.63%",
          "val2": "66.67%",
          "chgp": "-46.04%",
          "chgp_class": "negative"
        }
      ]
    }
  },
  {
    "link": "annual",
    "btn_text": "All Annual Results",
    "header": "Annual Results Snapshot (Consolidated) - Mar'26",
    "rhs": [
      {
        "prefix": "Net Sales ",
        "suffix": "YoY Growth in year ended Mar 2026 is -50.88% vs -34.91% in Mar 2025",
        "dir": -1
      },
      {
        "prefix": "Consolidated Net Profit ",
        "suffix": "YoY Growth in year ended Mar 2026 is -41.00% vs -352.57% in Mar 2025",
        "dir": 1
      }
    ],
    "table": {
      "header": [
        "Mar'26",
        "Mar'25",
        "Change(%)"
      ],
      "body": [
        {
          "field": "Net Sales",
          "val1": "1.96",
          "val2": "3.99",
          "chgp": "-50.88%",
          "chgp_class": "negative"
        },
        {
          "field": "Operating Profit (PBDIT) excl Other Income",
          "val1": "-0.67",
          "val2": "2.19",
          "chgp": "-130.59%",
          "chgp_class": "negative"
        },
        {
          "field": "Interest",
          "val1": "9.34",
          "val2": "9.90",
          "chgp": "-5.66%",
          "chgp_class": "positive"
        },
        {
          "field": "Exceptional Items",
          "val1": "0.00",
          "val2": "0.00",
          "chgp": "",
          "chgp_class": "neutral"
        },
        {
          "field": "Consolidate Net Profit",
          "val1": "-9.01",
          "val2": "-6.39",
          "chgp": "-41.00%",
          "chgp_class": "negative"
        },
        {
          "field": "Operating Profit Margin (Excl OI)",
          "val1": "-34.18%",
          "val2": "54.89%",
          "chgp": "-89.07%",
          "chgp_class": "negative"
        }
      ]
    }
  }
]

Quarterly Results Snapshot (Consolidated) - Mar'26 - YoYstock-summary

Mar'26
Mar'25
Change(%)
Net Sales
0.06
0.15
-60.00%
Operating Profit (PBDIT) excl Other Income
-1.09
-0.50
-118.00%
Interest
9.06
9.85
-8.02%
Exceptional Items
0.00
0.00
Consolidate Net Profit
-10.85
-10.66
-1.78%
Operating Profit Margin (Excl OI)
-1,816.67%
-333.33%
-1,483.34%
Values in Rs Cr.
Direction Arrows
Net Sales

YoY Growth in quarter ended Mar 2026 is -60.00% vs -71.15% in Mar 2025

Direction Arrows
Consolidated Net Profit

YoY Growth in quarter ended Mar 2026 is -1.78% vs -367.54% in Mar 2025

Half Yearly Results Snapshot (Consolidated) - Sep'25stock-summary

Sep'25
Sep'24
Change(%)
Net Sales
0.04
3.33
-98.80%
Operating Profit (PBDIT) excl Other Income
-0.88
2.47
-135.63%
Interest
0.24
0.05
380.00%
Exceptional Items
0.00
0.00
Consolidate Net Profit
0.02
3.56
-99.44%
Operating Profit Margin (Excl OI)
-2,200.00%
74.17%
-2,274.17%
Values in Rs Cr.
Direction Arrows
Net Sales

Growth in half year ended Sep 2025 is -98.80% vs 4.39% in Sep 2024

Direction Arrows
Consolidated Net Profit

Growth in half year ended Sep 2025 is -99.44% vs 25.35% in Sep 2024

Nine Monthly Results Snapshot (Consolidated) - Dec'25stock-summary

Dec'25
Dec'24
Change(%)
Net Sales
1.89
3.84
-50.78%
Operating Profit (PBDIT) excl Other Income
0.39
2.56
-84.77%
Interest
0.27
0.06
350.00%
Exceptional Items
0.00
0.00
Consolidate Net Profit
1.84
4.27
-56.91%
Operating Profit Margin (Excl OI)
20.63%
66.67%
-46.04%
Values in Rs Cr.
Direction Arrows
Net Sales

YoY Growth in nine months ended Dec 2025 is -50.78% vs -31.55% in Dec 2024

Direction Arrows
Consolidated Net Profit

YoY Growth in nine months ended Dec 2025 is -56.91% vs -11.23% in Dec 2024

Annual Results Snapshot (Consolidated) - Mar'26stock-summary

Mar'26
Mar'25
Change(%)
Net Sales
1.96
3.99
-50.88%
Operating Profit (PBDIT) excl Other Income
-0.67
2.19
-130.59%
Interest
9.34
9.90
-5.66%
Exceptional Items
0.00
0.00
Consolidate Net Profit
-9.01
-6.39
-41.00%
Operating Profit Margin (Excl OI)
-34.18%
54.89%
-89.07%
Values in Rs Cr.
Direction Arrows
Net Sales

YoY Growth in year ended Mar 2026 is -50.88% vs -34.91% in Mar 2025

Direction Arrows
Consolidated Net Profit

YoY Growth in year ended Mar 2026 is -41.00% vs -352.57% in Mar 2025

stock-summaryCompany CV
About IndiaNivesh Ltd stock-summary
stock-summary
IndiaNivesh Ltd
Micro Cap
Non Banking Financial Company (NBFC)
IndiaNivesh Limited was incorporated in May, 1931. The Company is actively involved, as a principal, in investing & financing activity, acquisition and management of Stressed Assets as well as Consultancy Services.
Company Coordinates stock-summary
Company Details
1703 17th Floor Lodha Supremus, Senapati Bapat Marg LowerParel Mumbai Maharashtra : 400013
stock-summary
Tel:
stock-summary
investorrelations@indianivesh.in
Registrar Details
Adroit Corporate Services Pvt Ltd, 17-20 Jaferbhoy Industrial Estate , 1st Floor, Makwana Road, Marol Naka, Mumbai