
Compare Hemo Organic with Similar Stocks
Dashboard
With a Negative Book Value, the company has a Weak Long Term Fundamental Strength
- Poor long term growth as Net Sales has grown by an annual rate of 38.20% and Operating profit at 0% over the last 5 years
- The company has a negative book value of Rs 0.93 crore
Flat results in Mar 26
Risky - Negative EBITDA
Stock DNA
Trading & Distributors
INR 8 Cr (Micro Cap)
NA (Loss Making)
15
0.00%
-1.87
78.00%
-7.68
Total Returns (Price + Dividend) 
Hemo Organic for the last several years.
Risk Adjusted Returns v/s
Returns Beta

News
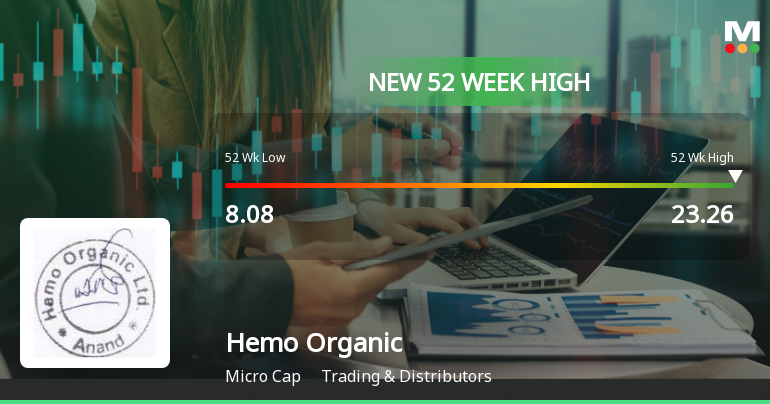
Broad-Based Technical Strength Lifts Hemo Organic Ltd to 52-Week High of Rs 23.26
From a 52-week low of Rs 8.08 to a fresh high of Rs 23.26 on 13 Jul 2026, Hemo Organic Ltd has surged an impressive 144% over the past year, significantly outpacing the Sensex’s decline of 6.4%. This milestone caps a sustained rally fuelled by a confluence of bullish technical indicators and robust price momentum.
Read full news articleAre Hemo Organic Ltd latest results good or bad?
Hemo Organic Ltd's latest financial results for Q4 FY26 reflect significant operational challenges. The company reported net sales of ₹0.93 crores, marking a return to revenue generation after three consecutive quarters of zero sales. However, this figure represents a substantial year-on-year decline of 61.41% from the previous year, indicating a severe contraction in business activity. The company faced a net loss of ₹0.51 crores, a stark contrast to the profit of ₹0.37 crores reported in the same quarter last year. This loss was accompanied by an operating margin of -31.18%, a notable decline from the positive margin of 5.81% achieved in Q4 FY25. The widening losses and negative margins underscore ongoing operational inefficiencies and challenges in sustaining profitability. Hemo Organic's balance sheet shows a negative book value of ₹-0.44 per share, reflecting complete equity erosion and raising conce...
Read full news article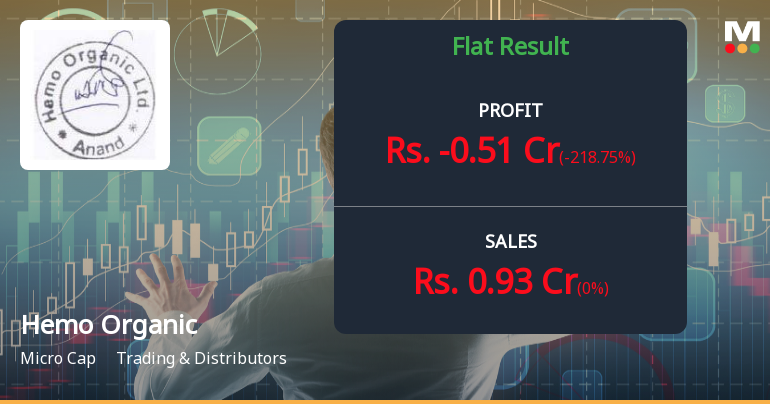
Hemo Organic Q4 FY26: Steep Losses Mount as Revenue Collapses 61% - Survival Questions Intensify
Hemo Organic Ltd., a micro-cap trading and distribution company with a market capitalisation of just ₹7.00 crores, reported deeply troubling results for Q4 FY26 that underscore mounting existential challenges. The company posted a net loss of ₹0.51 crores in the March 2026 quarter, a dramatic reversal from a profit of ₹0.37 crores in the year-ago period. Revenue collapsed by 61.41% year-on-year to just ₹0.93 crores, whilst the company's balance sheet remains mired in negative net worth territory at ₹-0.15 crores.
Read full news article Announcements
Board Meeting Intimation for The Meeting To Be Held On Wednesday 15Th July 2026
10-Jul-2026 | Source : BSEHemo Organic Ltdhas informed BSE that the meeting of the Board of Directors of the Company is scheduled on 15/07/2026 inter alia to consider and approve a) the Un-audited Financial Results of the Company for the quarter ended as on 30th June 2026 along with the Limited Review Report thereon. b)To transact other businesses as per agenda being circulated.
Compliances-Certificate under Reg. 74 (5) of SEBI (DP) Regulations 2018
10-Jul-2026 | Source : BSECertificate under Reg. 74(5) of SEBI (DP) Regulations 2018 for the quarter ended 30th June 2026
Closure of Trading Window
26-Jun-2026 | Source : BSEIntimation of closure of trading window
Corporate Actions

No Upcoming Board Meetings

No Dividend history available

No Splits history available

No Bonus history available

No Rights history available
Quality key factors
Valuation key factors
Technicals key factors
 Technical Indicator Scale: Bearish, Mildly Bearish, Sideways, Mildly Bullish, Bullish Turned
 Shareholding Snapshot : Mar 2026
Shareholding Compare (%holding)
Non Institution
None
Held by 0 Schemes
Held by 0 FIIs
Dineshbhai Shanabhai Patel (15.49%)
Mitalben Rupeshbhai Desai (3.49%)
71.01%
Quarterly Results Snapshot (Standalone) - Mar'26 - QoQ
QoQ Growth in quarter ended Mar 2026 is 0.00% vs 0.00% in Dec 2025

QoQ Growth in quarter ended Mar 2026 is -218.75% vs -433.33% in Dec 2025
Half Yearly Results Snapshot (Standalone) - Sep'25
Growth in half year ended Sep 2025 is 0.00% vs 0.00% in Sep 2024
Growth in half year ended Sep 2025 is -50.00% vs -166.67% in Sep 2024
Nine Monthly Results Snapshot (Standalone) - Dec'25
YoY Growth in nine months ended Dec 2025 is 0.00% vs 0.00% in Dec 2024
YoY Growth in nine months ended Dec 2025 is -75.00% vs -433.33% in Dec 2024
Annual Results Snapshot (Standalone) - Mar'26

YoY Growth in year ended Mar 2026 is -61.41% vs 11,950.00% in Mar 2025
YoY Growth in year ended Mar 2026 is -587.50% vs 161.54% in Mar 2025
About Hemo Organic Ltd

Company Coordinates


