
Compare Kohinoor Foods with Similar Stocks
Dashboard
With a Negative Book Value, the company has a Weak Long Term Fundamental Strength
- Poor long term growth as Net Sales has grown by an annual rate of -11.09% and Operating profit at 0% over the last 5 years
- The company has a negative book value of Rs 93.87 crore
Flat results in Mar 26
Risky - Negative EBITDA
Consistent Underperformance against the benchmark over the last 3 years
Stock DNA
Other Agricultural Products
INR 96 Cr (Micro Cap)
NA (Loss Making)
14
0.00%
-1.56
7.35%
-1.02
Total Returns (Price + Dividend) 
Latest dividend: 0.5600 per share ex-dividend date: Sep-14-2007
Risk Adjusted Returns v/s
Returns Beta

News
Kohinoor Foods Ltd is Rated Strong Sell
Kohinoor Foods Ltd is rated Strong Sell by MarketsMOJO, with this rating last updated on 30 December 2024. However, the analysis and financial metrics discussed here reflect the company’s current position as of 16 June 2026, providing investors with an up-to-date view of its performance and outlook.
Read full news article
Kohinoor Foods Ltd is Rated Strong Sell
Kohinoor Foods Ltd is rated Strong Sell by MarketsMOJO. This rating was last updated on 30 December 2024, reflecting a reassessment of the company’s outlook. However, all fundamentals, returns, and financial metrics discussed below are current as of 03 June 2026, providing an up-to-date view of the stock’s position in today’s market.
Read full news article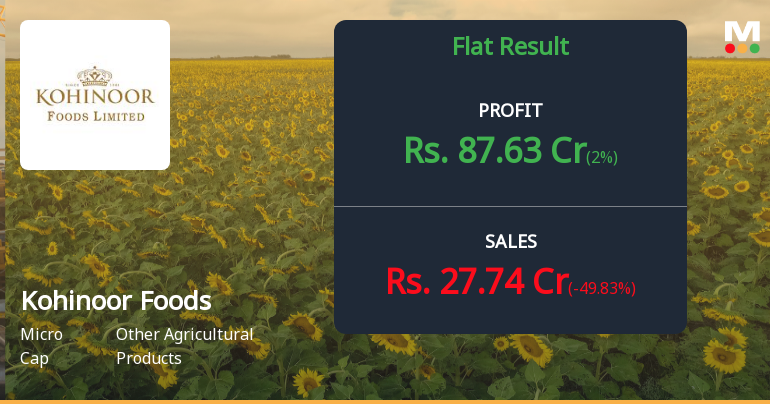
Kohinoor Foods Q4 FY26: Extraordinary Profit Masks Deeper Operational Struggles
Kohinoor Foods Ltd., the Basmati rice player operating from Sonepat, Haryana, reported a consolidated net profit of ₹87.63 crores for Q4 FY26 (quarter ended March 2026), representing a dramatic turnaround from the ₹4.23 crore loss posted in the previous quarter. However, this exceptional performance, which translates to a year-on-year decline of 76.67% from the extraordinary ₹375.63 crore profit in Q4 FY25, masks severe operational challenges that have investors deeply concerned about the company's underlying business health.
Read full news article Announcements
Board Meeting Outcome for Outcome
28-May-2026 | Source : BSEOutcome of board Meeting
Outcome Of Board Meeting
28-May-2026 | Source : BSEOutcome of Board Meeting
Intimation Of Board Meeting
20-May-2026 | Source : BSEIntimation of Board Meeting
Corporate Actions

No Upcoming Board Meetings

Kohinoor Foods Ltd has declared 10% dividend, ex-date: 14 Sep 07

No Splits history available

No Bonus history available

No Rights history available
Quality key factors
Valuation key factors
Technicals key factors
 Technical Indicator Scale: Bearish, Mildly Bearish, Sideways, Mildly Bullish, Bullish Turned
 Shareholding Snapshot : Mar 2026
Shareholding Compare (%holding)
Non Institution
None
Held by 0 Schemes
Held by 1 FIIs (0.03%)
Gurnam Arora (16.97%)
Al Dahra International Investments Llc (19.01%)
40.18%
Quarterly Results Snapshot (Consolidated) - Mar'26 - QoQ

QoQ Growth in quarter ended Mar 2026 is -49.83% vs 14.50% in Dec 2025

QoQ Growth in quarter ended Mar 2026 is 2,171.63% vs -504.29% in Dec 2025
Half Yearly Results Snapshot (Consolidated) - Sep'25
Growth in half year ended Sep 2025 is 36.66% vs -0.86% in Sep 2024
Growth in half year ended Sep 2025 is -6.18% vs 44.18% in Sep 2024
Nine Monthly Results Snapshot (Consolidated) - Dec'25
YoY Growth in nine months ended Dec 2025 is 79.60% vs -5.91% in Dec 2024
YoY Growth in nine months ended Dec 2025 is 35.90% vs -116.50% in Dec 2024
Annual Results Snapshot (Consolidated) - Mar'26
YoY Growth in year ended Mar 2026 is 70.85% vs -9.16% in Mar 2025
YoY Growth in year ended Mar 2026 is -77.12% vs 7,847.03% in Mar 2025
About Kohinoor Foods Ltd

Company Coordinates


