
Compare EIH with Similar Stocks
Dashboard
Company has a Debt to Equity ratio (avg) of 0.01 times
Healthy long term growth as Net Sales has grown by an annual rate of 42.68% and Operating profit at 32.45%
Flat results in Mar 26
With ROE of 13.7, it has a Expensive valuation with a 3.9 Price to Book Value
High Institutional Holdings at 20.5%
Stock DNA
Hotels & Resorts
INR 20,531 Cr (Small Cap)
29.00
38
0.46%
-0.16
13.66%
3.90
Total Returns (Price + Dividend) 
Latest dividend: 1.5 per share ex-dividend date: Jul-30-2025
Risk Adjusted Returns v/s
Returns Beta

News

EIH Ltd. Upgraded to Hold by MarketsMOJO on Technical Improvements and Valuation Stability
EIH Ltd., a prominent player in the Hotels & Resorts sector, has seen its investment rating upgraded from Sell to Hold as of 23 June 2026. This change reflects a nuanced reassessment across four critical parameters: Quality, Valuation, Financial Trend, and Technicals. Despite a modest day decline of 1.01% to close at ₹326.80, the stock’s outlook has improved, supported by a stabilising technical trend and solid long-term fundamentals.
Read full news article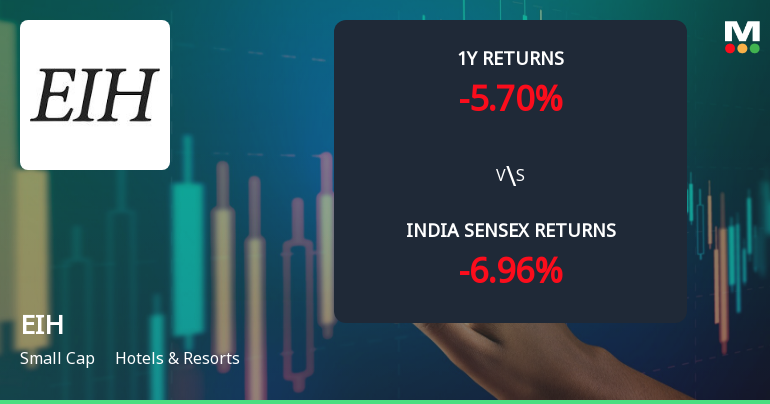
EIH Ltd. Technical Momentum Shifts Amid Mixed Market Signals
EIH Ltd., a key player in the Hotels & Resorts sector, has experienced a notable shift in its technical momentum, moving from a mildly bearish stance to a sideways trend. Despite a modest 1.01% decline in the latest session, the stock’s technical indicators reveal a complex interplay of bullish and bearish signals, suggesting a period of consolidation and cautious optimism among investors.
Read full news article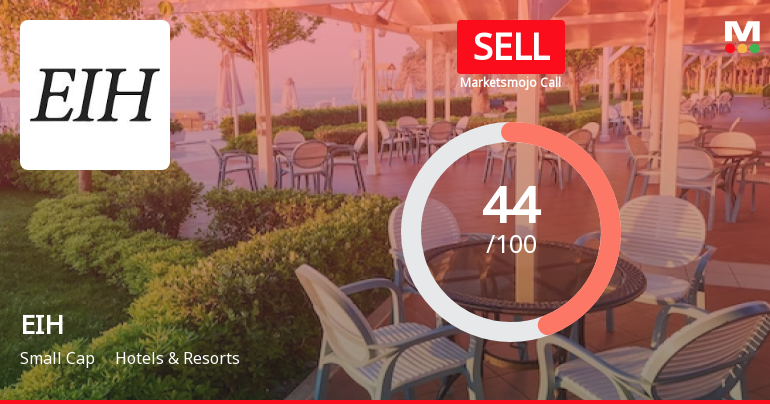
EIH Ltd. is Rated Sell by MarketsMOJO
EIH Ltd. is rated Sell by MarketsMOJO, with this rating last updated on 27 April 2026. However, the analysis and financial metrics discussed here reflect the company’s current position as of 22 June 2026, providing investors with the latest insights into the stock’s fundamentals, valuation, financial trends, and technical outlook.
Read full news article Announcements
Announcement under Regulation 30 (LODR)-Newspaper Publication
06-Jun-2026 | Source : BSEAs attached
Disclosure To Shareholders On Tax Deduction On Dividend
06-Jun-2026 | Source : BSEAs attached
Announcement under Regulation 30 (LODR)-Earnings Call Transcript
05-Jun-2026 | Source : BSEAs attached
Corporate Actions

No Upcoming Board Meetings

EIH Ltd. has declared 75% dividend, ex-date: 31 Jul 26

EIH Ltd. has announced 2:10 stock split, ex-date: 12 Sep 06

EIH Ltd. has announced 1:2 bonus issue, ex-date: 12 Sep 06

EIH Ltd. has announced 8:85 rights issue, ex-date: 22 Sep 20
Quality key factors
Valuation key factors
Technicals key factors
 Technical Indicator Scale: Bearish, Mildly Bearish, Sideways, Mildly Bullish, Bullish Turned
 Shareholding Snapshot : Mar 2026
Shareholding Compare (%holding)
Non Institution
None
Held by 22 Schemes (12.81%)
Held by 121 FIIs (6.62%)
Oberoi Hotels Private Limited (17.67%)
Reliance Strategic Business Ventures Limited (18.83%)
9.72%
Quarterly Results Snapshot (Consolidated) - Mar'26 - YoY

YoY Growth in quarter ended Mar 2026 is 8.19% vs 11.62% in Mar 2025
YoY Growth in quarter ended Mar 2026 is -6.06% vs 13.46% in Mar 2025
Half Yearly Results Snapshot (Consolidated) - Sep'25
Growth in half year ended Sep 2025 is 5.02% vs 8.44% in Sep 2024
Growth in half year ended Sep 2025 is -33.52% vs 12.80% in Sep 2024
Nine Monthly Results Snapshot (Consolidated) - Dec'25
YoY Growth in nine months ended Dec 2025 is 6.72% vs 8.24% in Dec 2024
YoY Growth in nine months ended Dec 2025 is -19.70% vs 16.90% in Dec 2024
Annual Results Snapshot (Consolidated) - Mar'26
YoY Growth in year ended Mar 2026 is 7.16% vs 9.23% in Mar 2025
YoY Growth in year ended Mar 2026 is -15.03% vs 15.70% in Mar 2025
About EIH Ltd.

Company Coordinates


