
Compare PG Electroplast with Similar Stocks
Stock DNA
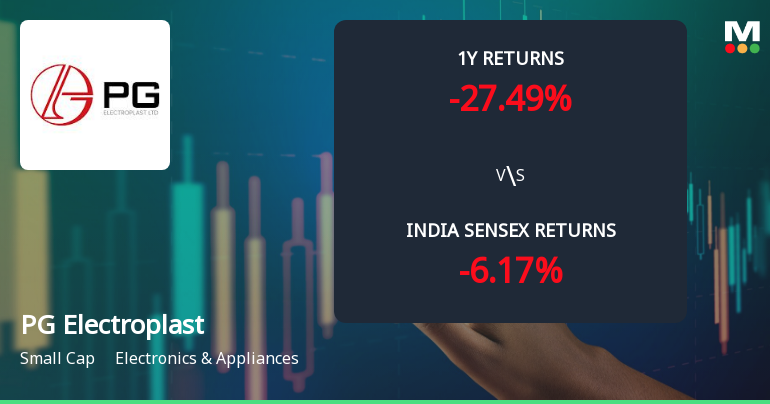
Electronics & Appliances
INR 15,772 Cr (Small Cap)
80.00
57
0.04%
0.07
6.45%
5.19
Total Returns (Price + Dividend) 
Latest dividend: 0.24864864864864863 per share ex-dividend date: Sep-19-2025
Risk Adjusted Returns v/s
Returns Beta

News
PG Electroplast Ltd Technical Momentum Shifts Amid Mixed Market Signals
PG Electroplast Ltd, a small-cap player in the Electronics & Appliances sector, has recently experienced a notable shift in its technical momentum, reflecting a complex interplay of bullish and bearish signals across multiple timeframes. Despite a modest day decline of 1.52%, the stock’s technical indicators reveal a nuanced picture that investors must carefully analyse to gauge future price direction.
Read full news article
PG Electroplast Ltd Technical Momentum Shifts Amid Mixed Market Signals
PG Electroplast Ltd, a small-cap player in the Electronics & Appliances sector, has experienced a notable shift in its technical momentum, reflecting a complex interplay of bullish and bearish signals across multiple timeframes. Despite a recent downgrade in its Mojo Grade from Hold to Sell, the stock’s price action and technical indicators suggest a sideways trend with pockets of optimism and caution for investors navigating this evolving landscape.
Read full news article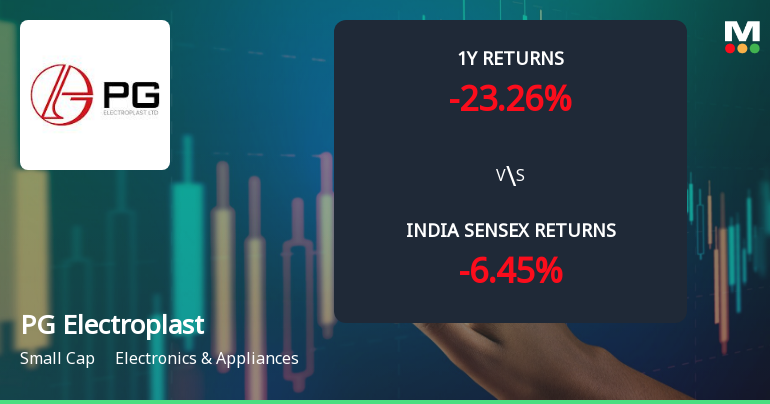
PG Electroplast Ltd Technical Momentum Shifts Amid Mixed Indicator Signals
PG Electroplast Ltd has experienced a notable shift in its technical momentum, transitioning from a sideways trend to a mildly bearish stance. Despite a modest 1.33% gain on 23 Jun 2026, the stock’s technical indicators present a complex picture, with mixed signals from MACD, RSI, Bollinger Bands, and moving averages, suggesting cautious investor sentiment amid evolving market dynamics.
Read full news article Announcements
Announcement under Regulation 30 (LODR)-Analyst / Investor Meet - Intimation
08-Jun-2026 | Source : BSEInvestor Meet Intimation Dated - 11.06.2026
Announcement under Regulation 30 (LODR)-Earnings Call Transcript
30-May-2026 | Source : BSETranscript of Earnings Conference Call.
Announcement under Regulation 30 (LODR)-Allotment of ESOP / ESPS
30-May-2026 | Source : BSEGrant of Options under PG Electroplast Employees Stock Option Scheme - 2020.
Corporate Actions

No Upcoming Board Meetings

PG Electroplast Ltd has declared 25% dividend, ex-date: 19 Sep 25

PG Electroplast Ltd has announced 1:10 stock split, ex-date: 10 Jul 24

No Bonus history available

No Rights history available
Quality key factors
Valuation key factors
Technicals key factors
 Technical Indicator Scale: Bearish, Mildly Bearish, Sideways, Mildly Bullish, Bullish Turned
 Shareholding Snapshot : Mar 2026
Shareholding Compare (%holding)
Promoters
None
Held by 27 Schemes (19.42%)
Held by 104 FIIs (9.74%)
Vishal Gupta (16.05%)
Motilal Oswal Nifty 500 Index Fund (4.74%)
18.03%
Quarterly Results Snapshot (Consolidated) - Mar'26 - YoY

YoY Growth in quarter ended Mar 2026 is -10.11% vs 77.40% in Mar 2025
YoY Growth in quarter ended Mar 2026 is -55.34% vs 108.81% in Mar 2025
Half Yearly Results Snapshot (Consolidated) - Sep'25
Growth in half year ended Sep 2025 is 8.40% vs 75.04% in Sep 2024
Growth in half year ended Sep 2025 is -32.30% vs 123.13% in Sep 2024
Nine Monthly Results Snapshot (Consolidated) - Dec'25
YoY Growth in nine months ended Dec 2025 is 20.67% vs 77.23% in Dec 2024
YoY Growth in nine months ended Dec 2025 is -7.62% vs 118.15% in Dec 2024
Annual Results Snapshot (Consolidated) - Mar'26
YoY Growth in year ended Mar 2026 is 8.59% vs 77.30% in Mar 2025
YoY Growth in year ended Mar 2026 is -31.70% vs 113.34% in Mar 2025
About PG Electroplast Ltd

Company Coordinates


