
Compare Denis Chem Lab with Similar Stocks
Stock DNA
Pharmaceuticals & Biotechnology
INR 98 Cr (Micro Cap)
11.00
36
2.15%
-0.27
9.18%
1.06
Total Returns (Price + Dividend) 
Latest dividend: 1.5 per share ex-dividend date: Sep-19-2025
Risk Adjusted Returns v/s
Returns Beta

News

Denis Chem Lab Ltd Upgraded to Sell on Technical Improvement Despite Weak Fundamentals
Denis Chem Lab Ltd has seen its investment rating upgraded from Strong Sell to Sell as of 27 Jul 2026, driven primarily by a shift in technical indicators despite persistent challenges in financial performance and valuation metrics. This nuanced change reflects a complex interplay of quality, valuation, financial trends, and technical signals that investors should carefully consider.
Read full news article
Denis Chem Lab Ltd is Rated Strong Sell
Denis Chem Lab Ltd is rated Strong Sell by MarketsMOJO, with this rating last updated on 06 July 2026. However, the analysis and financial metrics discussed here reflect the stock’s current position as of 20 July 2026, providing investors with an up-to-date view of the company’s fundamentals, valuation, financial trends, and technical outlook.
Read full news article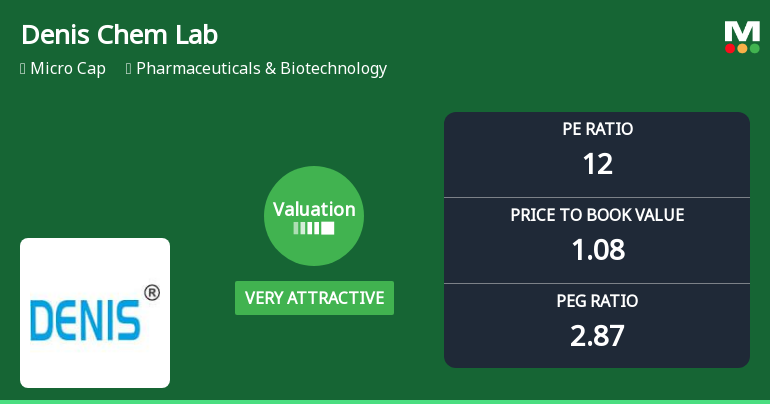
Denis Chem Lab Ltd Valuation Shifts to Very Attractive Amid Market Pressure
Denis Chem Lab Ltd, a micro-cap player in the Pharmaceuticals & Biotechnology sector, has seen a marked shift in its valuation parameters, moving from an attractive to a very attractive rating despite recent share price declines. This article analyses the evolving price attractiveness of the stock through key valuation metrics, peer comparisons, and market performance, providing investors with a comprehensive view of its current standing.
Read full news article Announcements
Shareholder Meeting - 45Th Annual General Meeting On 25Th September 2026
29-Jul-2026 | Source : BSEThe Board of Directors of the Company in their meeting held today decided the date of Board Meeting Record date for Dividend E-voting for AGM and other matters.
Announcement under Regulation 30 (LODR)-Change in Directorate
29-Jul-2026 | Source : BSEThe Board of Directors in their meeting held today reappointed Mr. Himanshu C. Patel as Managing Director of the Company for the period of 3 years with effect from 1st August 2026 subject to approval of shareholders in the ensuing general meeting.
Board Meeting Outcome for Outcome Of Board Meeting - Intimation Of Date Of Annual General Meeting E-Voting & Other Matters.
29-Jul-2026 | Source : BSEThe Board of Directors in their Meeting held today has decided Date of Annual General Meeting record date for Dividend Evoting for AGM and other matters.
Corporate Actions

No Upcoming Board Meetings

Denis Chem Lab Ltd has declared 15% dividend, ex-date: 19 Sep 25

No Splits history available

No Bonus history available

Denis Chem Lab Ltd has announced 2:11 rights issue, ex-date: 07 Sep 17
Quality key factors
Valuation key factors
Technicals key factors
 Technical Indicator Scale: Bearish, Mildly Bearish, Sideways, Mildly Bullish, Bullish Turned
 Shareholding Snapshot : Jun 2026
Shareholding Compare (%holding)
Non Institution
None
Held by 0 Schemes
Held by 1 FIIs (0.01%)
Anar Himanshu Patel (21.7%)
V-s Holding B.v. (20.74%)
29.48%
Quarterly Results Snapshot (Standalone) - Mar'26 - QoQ

QoQ Growth in quarter ended Mar 2026 is 2.70% vs -1.41% in Dec 2025

QoQ Growth in quarter ended Mar 2026 is -87.95% vs 50.23% in Dec 2025
Half Yearly Results Snapshot (Standalone) - Sep'25
Growth in half year ended Sep 2025 is 0.42% vs -46.92% in Sep 2024
Growth in half year ended Sep 2025 is -16.40% vs -49.73% in Sep 2024
Nine Monthly Results Snapshot (Standalone) - Dec'25
YoY Growth in nine months ended Dec 2025 is 2.31% vs 3.09% in Dec 2024
YoY Growth in nine months ended Dec 2025 is 8.68% vs -12.57% in Dec 2024
Annual Results Snapshot (Standalone) - Mar'26
YoY Growth in year ended Mar 2026 is 4.86% vs 3.27% in Mar 2025
YoY Growth in year ended Mar 2026 is 4.08% vs -27.60% in Mar 2025
About Denis Chem Lab Ltd

Company Coordinates


