
Compare Concord Drugs with Similar Stocks
Dashboard
Weak Long Term Fundamental Strength with an average Return on Capital Employed (ROCE) of 5.41%
- Poor long term growth as Net Sales has grown by an annual rate of 14.78% and Operating profit at 2.53% over the last 5 years
- Company's ability to service its debt is weak with a poor EBIT to Interest (avg) ratio of 1.56
With a growth in Net Profit of 1225%, the company declared Very Positive results in Mar 26
With ROCE of 5.2, it has a Attractive valuation with a 1.8 Enterprise value to Capital Employed
Majority shareholders : Promoters
Market Beating Performance
Stock DNA
Pharmaceuticals & Biotechnology
INR 100 Cr (Micro Cap)
94.00
35
0.00%
0.26
2.18%
2.06
Total Returns (Price + Dividend) 
Concord Drugs for the last several years.
Risk Adjusted Returns v/s
Returns Beta

News
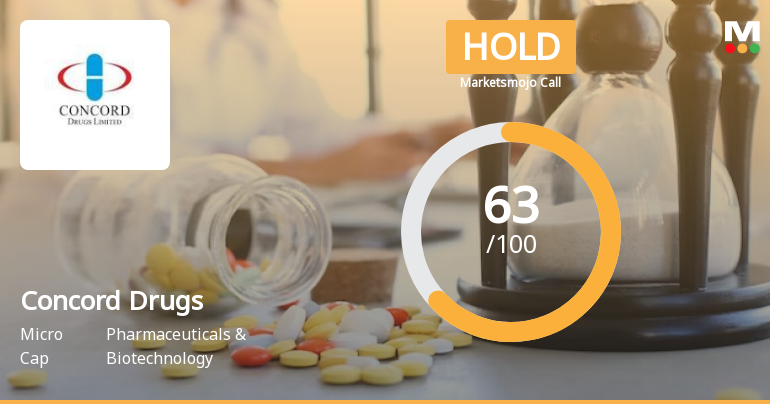
Concord Drugs Ltd is Rated Hold by MarketsMOJO
Concord Drugs Ltd is rated 'Hold' by MarketsMOJO, with this rating last updated on 27 May 2026. However, the analysis and financial metrics discussed here reflect the stock's current position as of 16 June 2026, providing investors with an up-to-date view of the company’s fundamentals, valuation, financial trends, and technical outlook.
Read full news article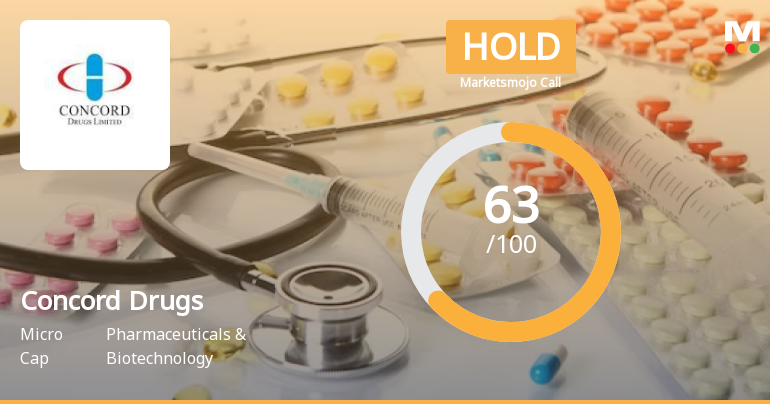
Concord Drugs Ltd is Rated Hold by MarketsMOJO
Concord Drugs Ltd is rated 'Hold' by MarketsMOJO, with this rating last updated on 27 May 2026. While the rating was revised on that date, the analysis and financial metrics presented here reflect the stock's current position as of 04 June 2026, providing investors with an up-to-date view of the company’s fundamentals, returns, and market performance.
Read full news article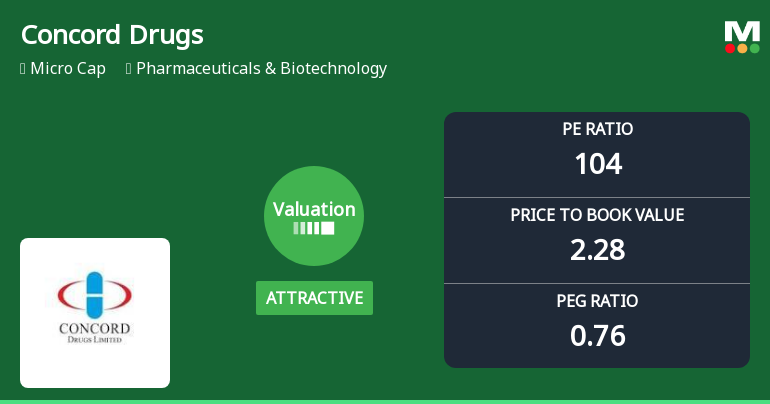
Concord Drugs Ltd Valuation Shifts to Attractive Amid Strong Market Performance
Concord Drugs Ltd has witnessed a notable shift in its valuation parameters, moving from an expensive to an attractive territory, driven by evolving price-to-earnings and price-to-book value metrics. This transition comes alongside robust stock performance that has significantly outpaced the Sensex over the past year, signalling renewed investor interest in this micro-cap pharmaceutical player.
Read full news article Announcements
Announcement under Regulation 30 (LODR)-Newspaper Publication
01-Jun-2026 | Source : BSECopy of Newspaper publication for audited results for year ended 31st March2026.
Financial Results For Year Ending 31St March2026
29-May-2026 | Source : BSEFinancial Results for Year ending 31st March 2026
Compliances-Reg.24(A)-Annual Secretarial Compliance
29-May-2026 | Source : BSEAnnual Secretarial Compliance report under Regulation 24(A)
Corporate Actions

No Upcoming Board Meetings

No Dividend history available

No Splits history available

No Bonus history available

No Rights history available
Quality key factors
Valuation key factors
Technicals key factors
 Technical Indicator Scale: Bearish, Mildly Bearish, Sideways, Mildly Bullish, Bullish Turned
 Shareholding Snapshot : Mar 2026
Shareholding Compare (%holding)
Promoters
None
Held by 0 Schemes
Held by 0 FIIs
Nagi Reddy Seelam (28.61%)
Ganga Devi Loya (1.94%)
44.66%
Quarterly Results Snapshot (Consolidated) - Mar'26 - YoY

YoY Growth in quarter ended Mar 2026 is 264.77% vs -33.57% in Mar 2025
YoY Growth in quarter ended Mar 2026 is 1,225.00% vs 111.76% in Mar 2025
Half Yearly Results Snapshot (Consolidated) - Sep'25

Growth in half year ended Sep 2025 is -0.75% vs 45.73% in Sep 2024
Growth in half year ended Sep 2025 is 342.86% vs -93.33% in Sep 2024
Nine Monthly Results Snapshot (Consolidated) - Dec'25
YoY Growth in nine months ended Dec 2025 is 17.24% vs 19.02% in Dec 2024
YoY Growth in nine months ended Dec 2025 is 76.67% vs -62.96% in Dec 2024
Annual Results Snapshot (Consolidated) - Mar'26
YoY Growth in year ended Mar 2026 is 74.08% vs 0.71% in Mar 2025
YoY Growth in year ended Mar 2026 is 211.76% vs -27.66% in Mar 2025
About Concord Drugs Ltd

Company Coordinates


