
Compare Ajooni Biotech with Similar Stocks
Stock DNA
Pharmaceuticals & Biotechnology
INR 65 Cr (Micro Cap)
15.00
34
0.00%
0.19
4.73%
0.70
Total Returns (Price + Dividend) 
Ajooni Biotech for the last several years.
Risk Adjusted Returns v/s
Returns Beta

News

Ajooni Biotech Ltd is Rated Sell
Ajooni Biotech Ltd is rated 'Sell' by MarketsMOJO, with this rating last updated on 01 Jan 2026. However, the analysis and financial metrics discussed here reflect the stock’s current position as of 17 June 2026, providing investors with an up-to-date view of the company’s fundamentals, returns, and market performance.
Read full news article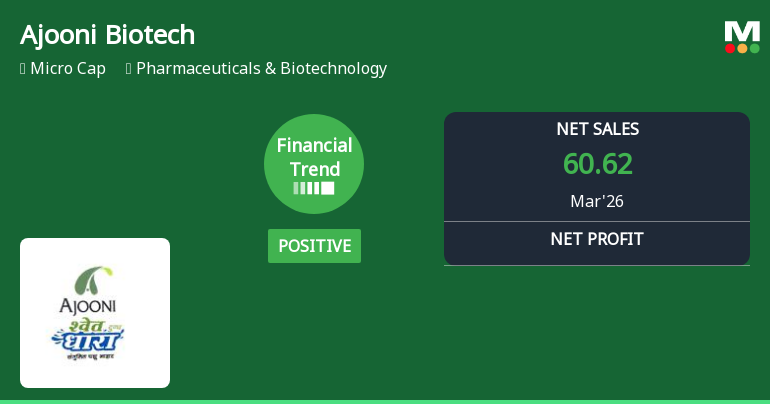
Ajooni Biotech Ltd Reports Mixed Quarterly Results Amid Shifting Financial Trends
Ajooni Biotech Ltd, a micro-cap player in the Pharmaceuticals & Biotechnology sector, posted its quarterly results for March 2026, reflecting a positive yet cautious financial trend. While net sales reached a record high, margin pressures and profitability challenges have tempered investor enthusiasm, leading to a downgrade in the company’s Mojo Grade from Strong Sell to Sell.
Read full news article
Ajooni Biotech Ltd is Rated Sell
Ajooni Biotech Ltd is rated 'Sell' by MarketsMOJO, with this rating last updated on 01 Jan 2026. However, the analysis and financial metrics discussed below reflect the stock's current position as of 26 May 2026, providing investors with an up-to-date perspective on the company’s fundamentals, valuation, financial trend, and technical outlook.
Read full news article Announcements
Ajooni Biotech Limited - Outcome of Board Meeting
14-Nov-2019 | Source : NSEAjooni Biotech Limited has informed the Exchange regarding Board meeting held on November 13, 2019.
Ajooni Biotech Limited - Clarification
23-Oct-2019 | Source : NSEAjooni Biotech Limited with respect to announcement dated 14-Oct-2019, that the Board of Directors in their meeting held on October 14, 2019 has considered and approved the resignation of Ms. Kanika Sapra, Company Secretary and Compliance Officer of the Company. On basis of above the Company is required to clarify following: 1. Date of resignation of Ms. Kanika Sapra. The response of the Company is awaited.
Corporate Actions

No Upcoming Board Meetings

No Dividend history available

Ajooni Biotech Ltd has announced 2:10 stock split, ex-date: 07 Oct 22

Ajooni Biotech Ltd has announced 1:9 bonus issue, ex-date: 10 Mar 21

Ajooni Biotech Ltd has announced 1:1 rights issue, ex-date: 07 May 24
Quality key factors
Valuation key factors
Technicals key factors
 Technical Indicator Scale: Bearish, Mildly Bearish, Sideways, Mildly Bullish, Bullish Turned
 Shareholding Snapshot : Mar 2026
Shareholding Compare (%holding)
Non Institution
None
Held by 0 Schemes
Held by 0 FIIs
Jasjot Singh (16.82%)
Anantharaman Janaki (1.87%)
65.52%
Quarterly Results Snapshot (Standalone) - Mar'26 - YoY

YoY Growth in quarter ended Mar 2026 is 107.11% vs 49.49% in Mar 2025

YoY Growth in quarter ended Mar 2026 is -38.31% vs 69.23% in Mar 2025
Half Yearly Results Snapshot (Standalone) - Sep'25
Growth in half year ended Sep 2025 is 22.62% vs 26.93% in Sep 2024
Growth in half year ended Sep 2025 is 58.33% vs 33.33% in Sep 2024
Nine Monthly Results Snapshot (Standalone) - Dec'25
YoY Growth in nine months ended Dec 2025 is 42.55% vs 41.10% in Dec 2024
YoY Growth in nine months ended Dec 2025 is 85.64% vs 44.80% in Dec 2024
Annual Results Snapshot (Standalone) - Mar'26
YoY Growth in year ended Mar 2026 is 59.02% vs 43.17% in Mar 2025
YoY Growth in year ended Mar 2026 is 28.19% vs 56.02% in Mar 2025
About Ajooni Biotech Ltd

Company Coordinates


