
Compare James Warren Tea with Similar Stocks
Total Returns (Price + Dividend) 
James Warren Tea for the last several years.
Risk Adjusted Returns v/s
Returns Beta

News

James Warren Tea Ltd. Downgraded to Strong Sell Amidst Deteriorating Financials and Valuation Concerns
James Warren Tea Ltd., a micro-cap player in the FMCG sector, has been downgraded from a Sell to a Strong Sell rating as of 8 June 2026, reflecting deteriorating fundamentals across multiple parameters. The downgrade follows a comprehensive reassessment of the company’s quality, valuation, financial trend, and technical outlook, highlighting significant challenges in both near-term performance and long-term growth prospects.
Read full news article
James Warren Tea Ltd. is Rated Sell by MarketsMOJO
James Warren Tea Ltd. is rated 'Sell' by MarketsMOJO, with this rating last updated on 02 Feb 2026. However, the analysis and financial metrics discussed here reflect the stock's current position as of 02 June 2026, providing investors with an up-to-date view of the company’s performance and outlook.
Read full news article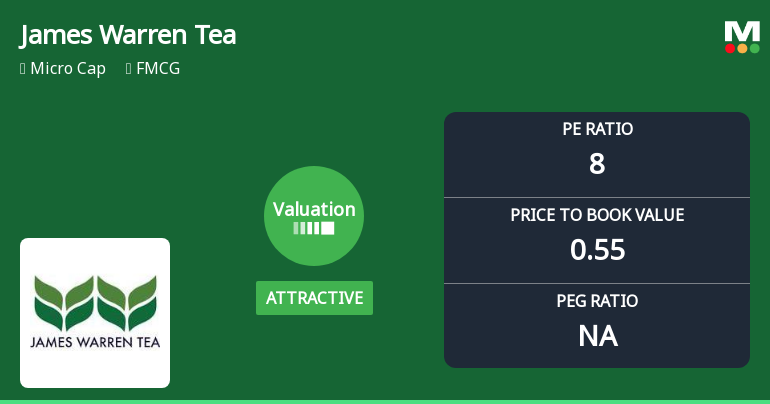
James Warren Tea Ltd: Valuation Shifts Signal Renewed Price Attractiveness Amid Market Challenges
James Warren Tea Ltd., a micro-cap player in the FMCG sector, has experienced a notable shift in its valuation parameters, moving from a very attractive to an attractive rating. Despite this positive change in price metrics, the company’s stock performance continues to lag behind broader market indices, reflecting ongoing challenges in the tea industry and investor sentiment.
Read full news article Announcements
Closure of Trading Window
19-Jun-2026 | Source : BSENotice for Closure of Trading Window
Announcement under Regulation 30 (LODR)-Newspaper Publication
19-Jun-2026 | Source : BSEAnnouncement under Regulation 30 of SEBI (LODR) 2015- Newspaper Publication
Announcement under Regulation 30 (LODR)-Newspaper Publication
30-May-2026 | Source : BSENewspaper Publication of Audited Financial Results for the quarter and year ended on 31st March 2026.
Corporate Actions

No Upcoming Board Meetings

No Dividend history available

No Splits history available

No Bonus history available

No Rights history available
Quality key factors
Valuation key factors
Technicals key factors
 Technical Indicator Scale: Bearish, Mildly Bearish, Sideways, Mildly Bullish, Bullish Turned
 Shareholding Snapshot : Mar 2026
Shareholding Compare (%holding)
Promoters
None
Held by 0 Schemes
Held by 0 FIIs
Ashdene Investments Limited (33.59%)
Lok Prakashan Ltd (2.1%)
26.46%
Quarterly Results Snapshot (Standalone) - Mar'26 - QoQ

QoQ Growth in quarter ended Mar 2026 is -90.70% vs -26.35% in Dec 2025
QoQ Growth in quarter ended Mar 2026 is -1,377.08% vs -106.89% in Dec 2025
Half Yearly Results Snapshot (Standalone) - Sep'25
Growth in half year ended Sep 2025 is -31.00% vs 43.24% in Sep 2024
Growth in half year ended Sep 2025 is -25.67% vs 214.44% in Sep 2024
Nine Monthly Results Snapshot (Standalone) - Dec'25
YoY Growth in nine months ended Dec 2025 is -31.48% vs 41.36% in Dec 2024
YoY Growth in nine months ended Dec 2025 is -41.47% vs 473.88% in Dec 2024
Annual Results Snapshot (Standalone) - Mar'26
YoY Growth in year ended Mar 2026 is -32.89% vs 42.11% in Mar 2025
YoY Growth in year ended Mar 2026 is -87.75% vs 5,293.62% in Mar 2025
About James Warren Tea Ltd.

Company Coordinates


