
Compare Cosmo First with Similar Stocks
Dashboard
Poor long term growth as Operating profit has grown by an annual rate -5.69% of over the last 5 years
- PBT LESS OI(Q) At Rs 47.84 cr has Grown at 154.6% (vs previous 4Q average)
- PAT(Latest six months) At Rs 71.01 cr has Grown at 25.34%
- ROCE(HY) Highest at 10.58%
With ROCE of 8.6, it has a Attractive valuation with a 1.2 Enterprise value to Capital Employed
Despite the size of the company, domestic mutual funds hold only 0.02% of the company
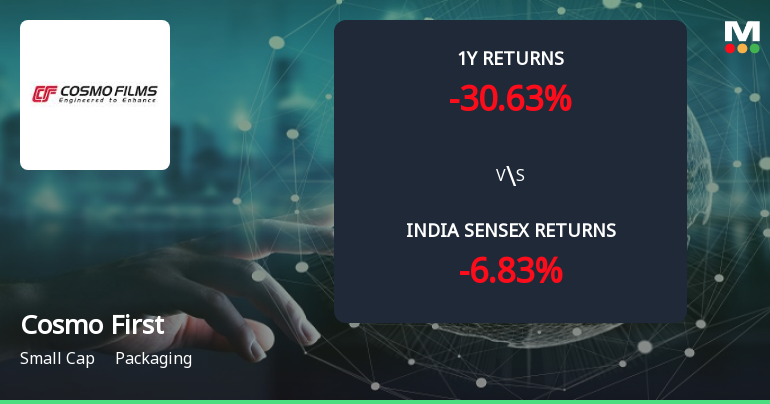
Underperformed the market in the last 1 year
Total Returns (Price + Dividend) 
Latest dividend: 4 per share ex-dividend date: Jul-28-2025
Risk Adjusted Returns v/s
Returns Beta

News
Golden Cross Forms in Cosmo First Ltd — On a Day the Stock Fell 1.65%. What the Mixed Signals Mean
The 50-day moving average has crossed above the 200-day moving average for Cosmo First Ltd, signalling a golden cross on 25 Jun 2026. Yet, the stock declined 1.65% on the day this technical event occurred, while monthly momentum indicators remain bearish. This juxtaposition of signals calls for a detailed examination of the broader technical and fundamental context.
Read full news article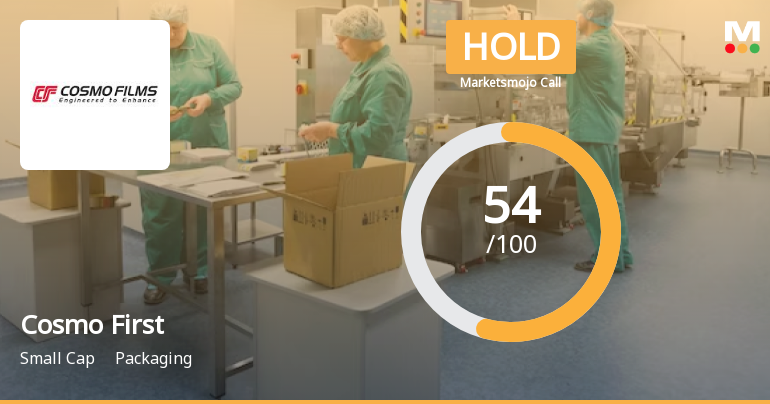
Cosmo First Ltd Upgraded to Hold as Technicals Improve Amid Mixed Financial Signals
Cosmo First Ltd, a small-cap player in the packaging sector, has seen its investment rating upgraded from Sell to Hold as of 24 June 2026. This change reflects a nuanced improvement across technical indicators, valuation metrics, financial trends, and overall quality assessments, signalling a cautious but more optimistic outlook for investors.
Read full news article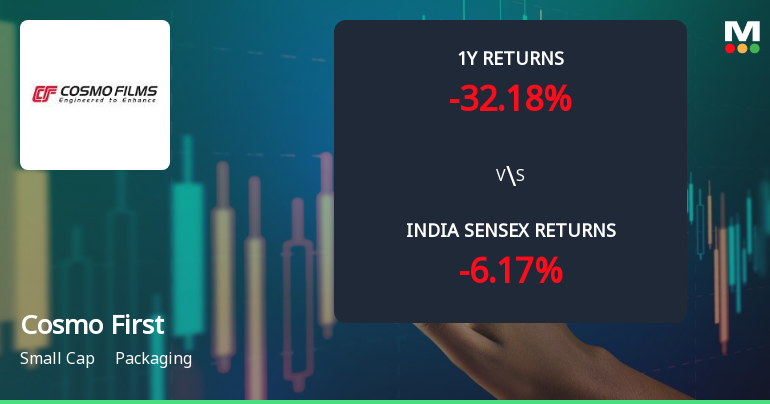
Cosmo First Ltd Technical Momentum Shifts Amid Mixed Market Signals
Cosmo First Ltd, a small-cap player in the packaging sector, has experienced a notable shift in its technical momentum, moving from a mildly bearish stance to a sideways trend. Despite a slight dip in price on 25 Jun 2026, the stock’s technical indicators reveal a complex interplay of bullish and bearish signals, suggesting a cautious outlook for investors navigating this evolving landscape.
Read full news article Announcements
Announcement under Regulation 30 (LODR)-Analyst / Investor Meet - Intimation
22-Jun-2026 | Source : BSEIntimation of Analyst/Investor Meet is scheduled to be held on Tuesday June 23 2026.
Announcement under Regulation 30 (LODR)-Newspaper Publication
05-Jun-2026 | Source : BSEAnnouncement under Regulation 30 (LODR) - Newspaper Publication
Announcement under Regulation 30 (LODR)-Earnings Call Transcript
28-May-2026 | Source : BSEAnnouncement under Regulation 30 (LODR)- Earnings Call Transcript.
Corporate Actions

No Upcoming Board Meetings

Cosmo First Ltd has declared 40% dividend, ex-date: 28 Jul 25

No Splits history available

Cosmo First Ltd has announced 1:2 bonus issue, ex-date: 16 Jun 22

No Rights history available
Quality key factors
Valuation key factors
Technicals key factors
 Technical Indicator Scale: Bearish, Mildly Bearish, Sideways, Mildly Bullish, Bullish Turned
 Shareholding Snapshot : Mar 2026
Shareholding Compare (%holding)
Non Institution
None
Held by 6 Schemes (0.01%)
Held by 47 FIIs (2.13%)
Ashok Jaipuria - Registered Owner C/o Gayatri& Annapurana - Beneficial Owner (36.14%)
Minaxi Bhalchandra Trivedi (1.64%)
41.75%
Quarterly Results Snapshot (Consolidated) - Mar'26 - QoQ

QoQ Growth in quarter ended Mar 2026 is 13.54% vs -2.18% in Dec 2025
QoQ Growth in quarter ended Mar 2026 is 25.12% vs -36.82% in Dec 2025
Half Yearly Results Snapshot (Consolidated) - Sep'25
Growth in half year ended Sep 2025 is 18.67% vs 9.64% in Sep 2024

Growth in half year ended Sep 2025 is 16.75% vs 116.39% in Sep 2024
Nine Monthly Results Snapshot (Consolidated) - Dec'25
YoY Growth in nine months ended Dec 2025 is 21.81% vs 10.44% in Dec 2024
YoY Growth in nine months ended Dec 2025 is 12.04% vs 127.02% in Dec 2024
Annual Results Snapshot (Consolidated) - Mar'26
YoY Growth in year ended Mar 2026 is 25.69% vs 11.89% in Mar 2025
YoY Growth in year ended Mar 2026 is 16.95% vs 114.46% in Mar 2025
About Cosmo First Ltd

Company Coordinates


