
Compare Pratik Panels with Similar Stocks
Stock DNA
Paper, Forest & Jute Products
INR 39 Cr (Micro Cap)
23.00
54
0.00%
0.00
21.28%
4.89
Total Returns (Price + Dividend) 
Pratik Panels for the last several years.
Risk Adjusted Returns v/s
Returns Beta

News

Pratik Panels Ltd is Rated Sell
Pratik Panels Ltd is rated 'Sell' by MarketsMOJO, with this rating last updated on 25 May 2026. However, the analysis and financial metrics discussed here reflect the stock's current position as of 02 July 2026, providing investors with the most recent insights into the company’s performance and outlook.
Read full news article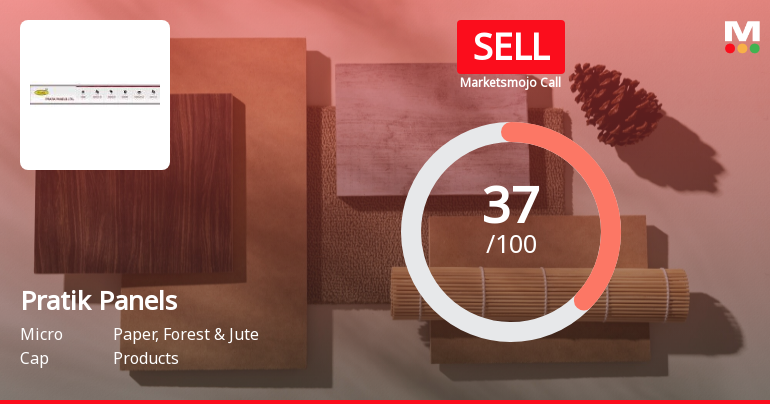
Pratik Panels Ltd is Rated Sell
Pratik Panels Ltd is rated 'Sell' by MarketsMOJO, with this rating last updated on 25 May 2026. However, the analysis and financial metrics discussed here reflect the stock's current position as of 18 June 2026, providing investors with an up-to-date view of the company’s fundamentals, valuation, financial trends, and technical outlook.
Read full news article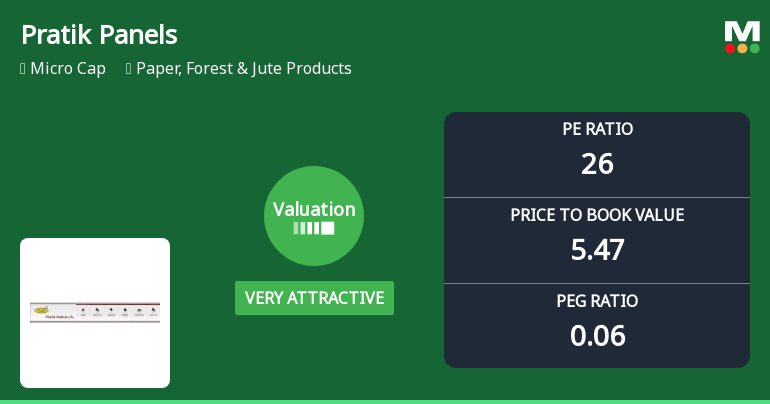
Pratik Panels Ltd Valuation Shifts Signal Renewed Price Attractiveness Amid Mixed Returns
Pratik Panels Ltd, a micro-cap player in the Paper, Forest & Jute Products sector, has witnessed a notable shift in its valuation parameters, moving from an attractive to a very attractive rating. Despite a recent day decline of 2.30%, the company’s price-to-earnings (P/E) and price-to-book value (P/BV) ratios suggest a compelling investment case relative to its historical averages and peer group, even as its market performance remains mixed against broader benchmarks like the Sensex.
Read full news article Announcements
Board Meeting Intimation for Intimation Under Regulation 29 Of SEBI (LODR) Regulations 2015 For Rescheduling Of Right Issue Committee Meeting
30-Jun-2026 | Source : BSEPratik Panels Ltdhas informed BSE that the meeting of the Board of Directors of the Company is scheduled on 06/07/2026 inter alia to consider and approve Intimation under regulation 29 of SEBI (LODR) Regulations 2015 for rescheduling of Right Issue Committee Meeting
Closure of Trading Window
26-Jun-2026 | Source : BSEIntimation of closure of trading window.
Board Meeting Intimation for Notice Of Right Issue Committee Meeting To Be Held On 30Th June 2026
24-Jun-2026 | Source : BSEPratik Panels Ltdhas informed BSE that the meeting of the Board of Directors of the Company is scheduled on 30/06/2026 inter alia to consider and approve Notice of Right issue committee meeting to be held on 30th June 2026
Corporate Actions

No Upcoming Board Meetings

No Dividend history available

No Splits history available

No Bonus history available

No Rights history available
Quality key factors
Valuation key factors
Technicals key factors
 Technical Indicator Scale: Bearish, Mildly Bearish, Sideways, Mildly Bullish, Bullish Turned
 Shareholding Snapshot : Dec 2025
Shareholding Compare (%holding)
Non Institution
None
Held by 0 Schemes
Held by 1 FIIs (6.03%)
Devyani Pankaj Mishra (0.0%)
Mintexrx Inc (6.03%)
82.38%
Quarterly Results Snapshot (Standalone) - Mar'26 - QoQ

QoQ Growth in quarter ended Mar 2026 is -16.53% vs 59.74% in Dec 2025
QoQ Growth in quarter ended Mar 2026 is -40.62% vs 48.84% in Dec 2025
Half Yearly Results Snapshot (Standalone) - Sep'25

Growth in half year ended Sep 2025 is 125.84% vs 0.00% in Sep 2024
Growth in half year ended Sep 2025 is 570.00% vs 166.67% in Sep 2024
Nine Monthly Results Snapshot (Standalone) - Dec'25
YoY Growth in nine months ended Dec 2025 is 186.62% vs 236.25% in Dec 2024
YoY Growth in nine months ended Dec 2025 is 991.67% vs -61.29% in Dec 2024
Annual Results Snapshot (Standalone) - Mar'26
YoY Growth in year ended Mar 2026 is 252.61% vs 18.15% in Mar 2025
YoY Growth in year ended Mar 2026 is 550.00% vs -44.68% in Mar 2025
About Pratik Panels Ltd

Company Coordinates


