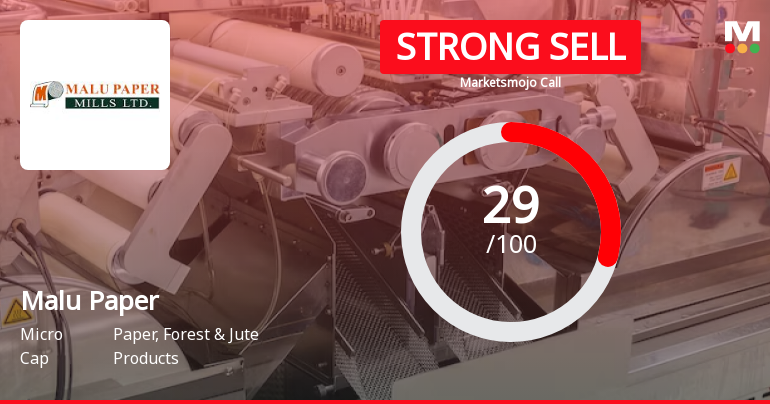
Malu Paper

  • Market Cap: Micro Cap
  • Industry: Paper, Forest & Jute Products
  • ISIN: INE383H01017
  • NSEID: MALUPAPER
  • BSEID: 532728
INR
31.80
-0.14 (-0.44%)
BSENSE

Sep 02, 09:44 AM

BSE+NSE Vol: 2.83 k

  • Price Points
  • Score
  • Mojo Parameters
  • Total Return
  • News and Corporate Actions
  • Key factors
  • Shareholding
  • Financials
  • CompanyCV
stock-summaryPrice Point
High/Low

1Day

52 Week

Valuation
Technical
Day's Volume

CASH

2.83 k (5,515.08%) Volume

Shareholding (Jun 2026)

FII

0.00%

Held by 0 FIIs

DII

0.00%

Held by 0 DIIs

Promoter

69.80%

Why is Malu Paper Mills Ltd falling/rising?

02-Sep-2026

As of 01-Sep, Malu Paper Mills Ltd's stock price is at 31.94, showing a slight increase but reflecting a significant decline of 15.68% over the past year, underperforming the Sensex. The stock's weak long-term fundamentals and decreased investor interest indicate ongoing challenges despite recent positive quarterly results.

As of 01-Sep, Malu Paper Mills Ltd's stock price is currently at 31.94, reflecting a change of 0.26 (0.82%) upward. Despite this slight increase, the stock has shown a consistent trend of underperformance over various periods. For instance, over the past year, the stock has declined by 15.68%, significantly underperforming the benchmark Sensex, which has only decreased by 2.31% during the same timeframe. <BR><BR>The stock's performance today has also been noted as underperforming its sector by 1.19%. Additionally, while the stock is trading higher than its 5-day and 50-day moving averages, it remains below its 20-day, 100-day, and 200-day moving averages, indicating a lack of strong upward momentum. <BR><BR>Investor participation has decreased, with delivery volume falling by 19.12% compared to the 5-day average, suggesting a decline in interest among investors. Furthermore, the company has a negative book value of Rs 17.44 crore and has recorded a negative EBIT of Rs. -1.44 crore, which raises concerns about its long-term financial health. <BR><BR>Although the company reported positive results in recent quarters, including a 30.29% growth in operating profit and a significant increase in net sales, these positive factors are overshadowed by the company's weak long-term fundamentals and consistent underperformance against benchmarks over the last three years. Therefore, despite the recent uptick in stock price, the overall context indicates that Malu Paper Mills Ltd is facing significant challenges that contribute to its ongoing decline in value.

View full answer

Who are in the management team of Malu Paper?

01-Sep-2026

The management team of Malu Paper includes Chairman Damodarlal Malu, Managing Director Punamchand Malu, Joint Managing Director Banwarilal Malu, and several independent directors, along with a Company Secretary and additional directors, overseeing the company's operations and strategy.

The management team of Malu Paper includes the following individuals:<BR><BR>1. **Damodarlal Malu** - Chairman<BR>2. **Vasudeo Malu** - Director<BR>3. **Satyanarayan Rathi** - Independent Director<BR>4. **Chandrakant Thakar** - Independent Director<BR>5. **Shyamsunder Sarda** - Independent Director<BR>6. **Punamchand Malu** - Managing Director<BR>7. **Banwarilal Malu** - Joint Managing Director<BR>8. **Shrutika Arvind Inani** - Independent Director<BR>9. **Mayuri Suresh Asawa** - Company Secretary<BR>10. **Purshottam Ramlal Malu** - Additional Director<BR>11. **Sahil Shankar Agrawal** - Additional Director<BR><BR>This team is responsible for overseeing the operations and strategic direction of the company.

View full answer

What does Malu Paper do?

01-Sep-2026

Malu Paper Mills Ltd manufactures newsprint, writing & printing paper, and kraft paper, and operates in the micro-cap segment of the Paper, Forest & Jute Products industry. As of June 2026, it reported net sales of 123 Cr and a net profit of 1 Cr, with a market cap of INR 55 Cr.

Overview: <BR>Malu Paper Mills Ltd is engaged in the manufacturing of newsprint, writing & printing paper, and kraft paper, operating within the micro-cap segment of the Paper, Forest & Jute Products industry.<BR><BR>History: <BR>Malu Paper Mills Limited was incorporated in 1994 and has been involved in various sectors, including steam coal trading and manufacturing welding electrodes, for over three decades. The latest quarterly results reported net sales and profit for June 2026.<BR><BR>Financial Snapshot: <BR>Most recent Net Sales: 123 Cr (Quarterly Results - Jun 2026) <BR>Most recent Net Profit: 1 Cr (Quarterly Results - Jun 2026) <BR>Market-cap value: INR 55 Cr (Micro Cap)<BR><BR>Key Metrics: <BR>P/E: N/A <BR>Industry P/E: 15 <BR>Dividend Yield: 0.00% <BR>Debt-Equity: -8.23 <BR>Return on Equity: 70.01% <BR>Price to Book: -3.08<BR><BR>Contact Details: <BR>Address: Heera Plaza 4th Floor, Nr Telephne Exchange Centl Ave Nagpur Maharashtra : 440008 <BR>Tel: 91-712-2760308 <BR>Email: info@malupaper.com <BR>Website: http://www.malupaper.com

View full answer

Who are the peers of the Malu Paper?

01-Sep-2026

Malu Paper's peers include Nath Industries, Cella Space, AI Champ. Inds., and others. Cella Space shows excellent growth and the highest 1-year return at 143.15%, while AI Champ. Inds. has the lowest return at -60.63%, and Malu Paper's return is -14.19%.

Peers: Nath Industries, Cella Space, AI Champ.Inds., Balkrishna Paper, Perfectpac, Three M Paper, Grameva, Mohit Paper Mill, Kay Power &Paper.<BR><BR>Quality Snapshot: Excellent growth is observed at Cella Space, while Average management risk is found at Nath Industries and Kay Power &Paper. Below Average management risk is noted at Cella Space, AI Champ.Inds., Three M Paper, Mohit Paper Mill, and the rest. Below Average growth is seen at Nath Industries, AI Champ.Inds., Perfectpac, and the rest. Good capital structure is present at Perfectpac, while Below Average capital structure is found at Nath Industries, Cella Space, AI Champ.Inds., Three M Paper, Grameva, Mohit Paper Mill, Kay Power &Paper, and the rest.<BR><BR>Return Snapshot: Cella Space has the highest 1-year return at 143.15%, while AI Champ.Inds. has the lowest at -60.63%. Malu Paper's 1-year return is -14.19%, which is higher than AI Champ.Inds. but lower than Cella Space. Additionally, Nath Industries, AI Champ.Inds., Perfectpac, Three M Paper, and Kay Power &Paper all have negative six-month returns.

View full answer

How big is Malu Paper?

01-Sep-2026

As of 31st August, Malu Paper Mills Ltd has a market capitalization of 55.00 Cr, with net sales of 362.90 Cr and a net loss of 12.21 Cr over the latest four quarters. Shareholder's funds were recorded at a loss of 5.72 Cr, with total assets of 156.76 Cr as of March 2025.

As of 31st August, Malu Paper Mills Ltd has a market capitalization of 55.00 Cr, which classifies it as a Micro Cap company.<BR><BR>In the latest four quarters, Malu Paper Mills Ltd reported net sales of 362.90 Cr. However, the company experienced a net loss of 12.21 Cr during the same period.<BR><BR>The latest annual period for the balance sheet is March 2025. At that time, the shareholder's funds were recorded at a loss of 5.72 Cr, while total assets amounted to 156.76 Cr.

View full answer

Are Malu Paper Mills Ltd latest results good or bad?

24-Jul-2026

Malu Paper Mills Ltd's latest results show significant revenue growth of 30.84% and a return to profitability, but the company faces serious financial challenges, including a negative book value and a "Strong Sell" recommendation from analysts. While there are positive signs, the overall outlook remains uncertain due to these underlying issues.

Malu Paper Mills Ltd's latest results show a mixed picture. On one hand, the company reported a significant revenue growth of 30.84% year-on-year, reaching ₹123.42 crores, and achieved its first net profit in several quarters, amounting to ₹1.28 crores. This marks a notable turnaround from the previous year's losses, indicating some operational improvements and a recovery in demand.<BR><BR>The operating margin also improved to 4.74%, a positive shift from the negative margins seen in the past. These metrics suggest that the company is making strides in stabilizing its operations after a challenging period.<BR><BR>However, despite these encouraging signs, Malu Paper Mills continues to face serious underlying issues. The company has a negative book value of ₹-3.35 per share, reflecting a precarious financial position with accumulated losses exceeding its paid-up capital. Analysts have issued a "Strong Sell" recommendation due to these structural challenges, including a deteriorating balance sheet and significant working capital deficits.<BR><BR>In summary, while the latest results indicate a positive trend in revenue and profitability, the fundamental challenges facing the company make its outlook uncertain. Investors should weigh the potential for recovery against the risks associated with its financial health.

View full answer

Should I buy, sell or hold Malu Paper Mills Ltd?

30-May-2026

When is the next results date for Malu Paper Mills Ltd?

22-May-2026

The next results date for Malu Paper Mills Ltd is 28 May 2026.

The next results date for Malu Paper Mills Ltd is scheduled for 28 May 2026.

View full answer

How has been the historical performance of Malu Paper?

03-Dec-2025

Malu Paper has experienced fluctuating performance, with net sales increasing from INR 169.74 crore in March 2021 to INR 277.89 crore in March 2025, but profitability has declined significantly, resulting in negative operating profit and shareholder funds by March 2025. Despite sales growth, the company's financial stability has deteriorated, as reflected in its negative profit after tax and book value per share.

Answer:<BR>The historical performance of Malu Paper has shown significant fluctuations over the years, particularly in its profitability and financial stability.<BR><BR>Breakdown:<BR>Malu Paper's net sales have generally increased from INR 169.74 crore in March 2021 to INR 277.89 crore in March 2025, with a notable rise from INR 233.89 crore in March 2023 to INR 274.44 crore in March 2024, before reaching its peak in March 2025. However, the company's total operating income followed a similar trend, peaking at INR 278.44 crore in March 2025. Despite the growth in sales, the total expenditure has also risen, leading to an operating profit (PBDIT) that turned negative at -0.37 crore in March 2025, compared to a positive INR 17.37 crore in March 2024. This decline in profitability is reflected in the profit before tax, which fell to -17.13 crore in March 2025 from a profit of 1.47 crore in March 2024. Consequently, the profit after tax also turned negative, reaching -12.13 crore in March 2025. The company's shareholder's funds have deteriorated significantly, dropping to -5.72 crore in March 2025 from 6.80 crore in March 2024, indicating a decline in financial health. Additionally, the book value per share has decreased to -3.35 in March 2025 from 3.98 in March 2024, further highlighting the challenges faced by the company. Overall, while Malu Paper has seen growth in sales, its profitability and financial stability have faced considerable challenges in recent years.

View full answer

Is Malu Paper overvalued or undervalued?

09-Jun-2025

As of February 11, 2025, Malu Paper is considered overvalued and risky, with concerning financial ratios such as a PE of -5.54 and an EV to EBITDA of -203.22, especially when compared to peers like JK Paper and West Coast Paper, despite a recent return of 19.22% over the past year.

As of 11 February 2025, the valuation grade for Malu Paper has moved from expensive to risky, indicating a significant deterioration in its financial standing. The company is currently assessed as overvalued. Key ratios highlight this concern: the PE ratio stands at -5.54, the EV to EBITDA ratio is an alarming -203.22, and the ROE is an extraordinarily low -1213.00%. <BR><BR>In comparison to its peers, Malu Paper's valuation metrics are starkly unfavorable. For instance, JK Paper, categorized as very attractive, has a PE ratio of 15.48 and an EV to EBITDA of 8.36, while West Coast Paper, rated as fair, has a PE of 10.55 and an EV to EBITDA of 5.21. These comparisons underscore Malu Paper's precarious position in the market. Despite a recent positive return of 19.22% over the past year compared to the Sensex's 7.61%, the underlying financial ratios suggest that the stock remains overvalued relative to its peers.

View full answer

What is the technical trend for Malu Paper?

09-Jun-2025

As of May 3, 2025, Malu Paper's technical trend is mildly bearish, influenced by daily moving averages, while mixed signals from weekly MACD and Bollinger Bands create uncertainty.

As of 3 May 2025, the technical trend for Malu Paper has changed from sideways to mildly bearish. The daily moving averages indicate a mildly bearish stance, while the weekly MACD and KST show a mildly bullish outlook, creating a mixed picture. The Bollinger Bands are bullish on the weekly but mildly bearish on the monthly, further contributing to the uncertainty. The OBV is mildly bearish on the weekly, contrasting with a mildly bullish monthly view. Overall, the current technical stance is mildly bearish, driven primarily by the daily moving averages and the mixed signals from the MACD and Bollinger Bands.

View full answer

Who are the top shareholders of the Malu Paper?

06-Jun-2025

The top shareholders of Malu Paper are primarily promoters, with Frontline Commercial Pvt. Ltd. holding 8.88%. Individual investors own 24.33% of the shares, while the highest public shareholder, Bips Tradecom LLP, holds 0%.

The top shareholders of Malu Paper primarily consist of promoters, with Frontline Commercial Pvt. Ltd. holding the highest stake at 8.88%. There are no pledged promoter holdings, and the company does not have any mutual funds or foreign institutional investors (FIIs) involved. Individual investors collectively hold 24.33% of the shares, while the highest public shareholder is Bips Tradecom LLP, which holds 0%.

View full answer

Has Malu Paper declared dividend?

06-Jun-2025

No Dividend History Available

iScoreScore
Click here to find our call on this stock
Strong Sell
Sell
Hold
Buy
Strong Buy

Dashboard

1

With a Negative Book Value, the company has a Weak Long Term Fundamental Strength

  • Poor long term growth as Net Sales has grown by an annual rate of 14.84% and Operating profit at 0% over the last 5 years
  • The company has a negative book value of Rs 17.44 crore
2

Risky - Negative Operating Profits

stock-summaryMojo Parameters

Mojo Parameters

Loading Valuation Snapshot...

Stock DNA

stock-summary
Industry

Paper, Forest & Jute Products

stock-summary
Market cap

INR 54 Cr (Micro Cap)

stock-summary
P/E

NA (Loss Making)

stock-summary
Industry P/E

15

stock-summary
Dividend Yield

0.00%

stock-summary
Debt Equity

-8.23

stock-summary
Return on Equity

70.01%

stock-summary
Price to Book

-3.12

Revenue and Profits:
Net Sales:
123 Cr
(Quarterly Results - Jun 2026)
Net Profit:
1 Cr
stock-summaryTotal Returns
Total Returns (Price + Dividend) stock-summary
Dividend Yield (0%)
TimePeriod
Price Return
Dividend Return
Total Return
3 Months
-2.18%
0%
-2.18%
6 Months
-0.69%
0%
-0.69%
1 Year
-15.78%
0%
-15.78%
2 Years
-33.22%
0%
-33.22%
3 Years
-9.53%
0%
-9.53%
4 Years
-11.05%
0%
-11.05%
5 Years
-10.42%
0%
-10.42%

Malu Paper for the last several years.

Risk Adjusted Returns v/s stock-summary
Returns Beta
Icon
Beta has not been calculated since enough price history is not available
stock-summaryNews & Corporate Actions

News

Announcements stock-summary

Malu Paper Mills Limited - Other General Purpose

05-Dec-2019 | Source : NSE

Malu Paper Mills Limited has informed the Exchange regarding Disclosure under Regulation 23(9) of SEBI (Listing Obligations and Disclosure Requirements) Regulations, 2015 for half year ended September 30, 2019.

Malu Paper Mills Limited - Press Release

15-Nov-2019 | Source : NSE

Malu Paper Mills Limited has informed the Exchange regarding a press release dated November 09, 2019, titled "Announcement under Reg 30 (LODR), 2015-Newspaper Publication".

Malu Paper Mills Limited - Clarification - Financial Results

14-Nov-2019 | Source : NSE

Malu Paper Mills Limited Mills Limited for the quarter ended 30-Sep-2019 with respect to Regulation 33 of the SEBI (Listing Obligations and Disclosure Requirements) Regulations, 2015.

Corporate Actions stock-summary

stock-summary
BOARD MEETING

No Upcoming Board Meetings

stock-summary
DIVIDEND

No Dividend history available

stock-summary
SPLITS

No Splits history available

stock-summary
BONUS

No Bonus history available

stock-summary
RIGHTS

No Rights history available

stock-summaryKey Factors

Quality key factors stock-summary

Factor
Value
Sales Growth (5y)
14.84%
EBIT Growth (5y)
-189.84%
EBIT to Interest (avg)
0
Debt to EBITDA (avg)
Negative Net Debt
Net Debt to Equity (avg)
-8.23
Sales to Capital Employed (avg)
0
Tax Ratio
Tax Ratio is Negative%
Dividend Payout Ratio
0
Pledged Shares
0
Institutional Holding
0
ROCE (avg)
-0.18%
ROE (avg)
0

Valuation key factors

Factor
Value
P/E Ratio
NA (Loss Making)
Industry P/E
8
Price to Book Value
-3.12
EV to EBIT
-137.48
EV to EBITDA
48.28
EV to Capital Employed
1.57
EV to Sales
0.54
PEG Ratio
NA
Dividend Yield
NA
ROCE (Latest)
-10.93%
ROE (Latest)
Negative BV

Technicals key factors

Indicator
Weekly
Monthly
MACD
Mildly Bullish
Bearish
RSI
No Signal
No Signal
Bollinger Bands
Mildly Bearish
Bearish
Moving Averages
Mildly Bearish (Daily)
KST
Mildly Bullish
Bearish
Dow Theory
No Trend
No Trend
OBV
No Trend
No Trend
stock-summary Technical Indicator Scale: Bearish, Mildly Bearish, Sideways, Mildly Bullish, Bullish  Turned 
stock-summaryShareholding
Shareholding Snapshot : Jun 2026stock-summary
Shareholding Compare (%holding) stock-summary
Majority shareholders

Promoters

Pledged Promoter Holdings

None

Mutual Funds

Held by 0 Schemes

FIIs

Held by 0 FIIs

Promoter with highest holding

Frontline Commercial Pvt. Ltd. (8.88%)

Highest Public shareholder

Bips Tradecom Llp (2.13%)

Individual Investors Holdings

24.36%

stock-summaryFinancial
[
  {
    "link": "quarterly",
    "btn_text": "All Quarterly Results",
    "header": "Quarterly Results Snapshot (Standalone) - Jun'26 - QoQ",
    "rhs": [
      {
        "prefix": "Net Sales ",
        "suffix": "QoQ Growth in quarter ended Jun 2026 is 16.09% vs 38.46% in Mar 2026",
        "dir": -1
      },
      {
        "prefix": "Standalone Net Profit ",
        "suffix": "QoQ Growth in quarter ended Jun 2026 is 145.71% vs 45.10% in Mar 2026",
        "dir": 1
      }
    ],
    "table": {
      "header": [
        "Jun'26",
        "Mar'26",
        "Change(%)"
      ],
      "body": [
        {
          "field": "Net Sales",
          "val1": "123.42",
          "val2": "106.31",
          "chgp": "16.09%",
          "chgp_class": "positive"
        },
        {
          "field": "Operating Profit (PBDIT) excl Other Income",
          "val1": "5.85",
          "val2": "4.49",
          "chgp": "30.29%",
          "chgp_class": "positive"
        },
        {
          "field": "Interest",
          "val1": "2.59",
          "val2": "2.82",
          "chgp": "-8.16%",
          "chgp_class": "positive"
        },
        {
          "field": "Exceptional Items",
          "val1": "0.00",
          "val2": "0.00",
          "chgp": "",
          "chgp_class": "neutral"
        },
        {
          "field": "Standalone Net Profit",
          "val1": "1.28",
          "val2": "-2.80",
          "chgp": "145.71%",
          "chgp_class": "positive"
        },
        {
          "field": "Operating Profit Margin (Excl OI)",
          "val1": "4.74%",
          "val2": "4.22%",
          "chgp": "0.52%",
          "chgp_class": "positive"
        }
      ]
    }
  },
  {
    "link": "half-yearly",
    "btn_text": "All Half Yearly Results",
    "header": "Half Yearly Results Snapshot (Standalone) - Sep'25",
    "rhs": [
      {
        "prefix": "Net Sales ",
        "suffix": " Growth in half year ended Sep 2025 is 23.31% vs -11.34% in Sep 2024",
        "dir": 1
      },
      {
        "prefix": "Standalone Net Profit ",
        "suffix": " Growth in half year ended Sep 2025 is -108.16% vs -1,381.82% in Sep 2024",
        "dir": 1
      }
    ],
    "table": {
      "header": [
        "Sep'25",
        "Sep'24",
        "Change(%)"
      ],
      "body": [
        {
          "field": "Net Sales",
          "val1": "150.72",
          "val2": "122.23",
          "chgp": "23.31%",
          "chgp_class": "positive"
        },
        {
          "field": "Operating Profit (PBDIT) excl Other Income",
          "val1": "-7.91",
          "val2": "-0.01",
          "chgp": "-79,000.00%",
          "chgp_class": "negative"
        },
        {
          "field": "Interest",
          "val1": "5.65",
          "val2": "5.10",
          "chgp": "10.78%",
          "chgp_class": "negative"
        },
        {
          "field": "Exceptional Items",
          "val1": "0.00",
          "val2": "0.00",
          "chgp": "",
          "chgp_class": "neutral"
        },
        {
          "field": "Standalone Net Profit",
          "val1": "-11.74",
          "val2": "-5.64",
          "chgp": "-108.16%",
          "chgp_class": "negative"
        },
        {
          "field": "Operating Profit Margin (Excl OI)",
          "val1": "-5.25%",
          "val2": "-0.01%",
          "chgp": "-5.24%",
          "chgp_class": "negative"
        }
      ]
    }
  },
  {
    "link": "nine-monthly",
    "btn_text": "All Nine Monthly Results",
    "header": "Nine Monthly Results Snapshot (Standalone) - Dec'25",
    "rhs": [
      {
        "prefix": "Net Sales ",
        "suffix": "YoY Growth in nine months ended Dec 2025 is 23.07% vs -7.21% in Dec 2024",
        "dir": 1
      },
      {
        "prefix": "Standalone Net Profit ",
        "suffix": "YoY Growth in nine months ended Dec 2025 is -80.88% vs -1,263.75% in Dec 2024",
        "dir": 1
      }
    ],
    "table": {
      "header": [
        "Dec'25",
        "Dec'24",
        "Change(%)"
      ],
      "body": [
        {
          "field": "Net Sales",
          "val1": "227.50",
          "val2": "184.85",
          "chgp": "23.07%",
          "chgp_class": "positive"
        },
        {
          "field": "Operating Profit (PBDIT) excl Other Income",
          "val1": "-11.00",
          "val2": "-1.07",
          "chgp": "-928.04%",
          "chgp_class": "negative"
        },
        {
          "field": "Interest",
          "val1": "8.57",
          "val2": "7.92",
          "chgp": "8.21%",
          "chgp_class": "negative"
        },
        {
          "field": "Exceptional Items",
          "val1": "0.00",
          "val2": "0.00",
          "chgp": "",
          "chgp_class": "neutral"
        },
        {
          "field": "Standalone Net Profit",
          "val1": "-16.84",
          "val2": "-9.31",
          "chgp": "-80.88%",
          "chgp_class": "negative"
        },
        {
          "field": "Operating Profit Margin (Excl OI)",
          "val1": "-4.83%",
          "val2": "-0.58%",
          "chgp": "-4.25%",
          "chgp_class": "negative"
        }
      ]
    }
  },
  {
    "link": "annual",
    "btn_text": "All Annual Results",
    "header": "Annual Results Snapshot (Standalone) - Mar'26",
    "rhs": [
      {
        "prefix": "Net Sales ",
        "suffix": "YoY Growth in year ended Mar 2026 is 20.12% vs 1.26% in Mar 2025",
        "dir": 1
      },
      {
        "prefix": "Standalone Net Profit ",
        "suffix": "YoY Growth in year ended Mar 2026 is -61.91% vs -1,447.78% in Mar 2025",
        "dir": 1
      }
    ],
    "table": {
      "header": [
        "Mar'26",
        "Mar'25",
        "Change(%)"
      ],
      "body": [
        {
          "field": "Net Sales",
          "val1": "333.81",
          "val2": "277.89",
          "chgp": "20.12%",
          "chgp_class": "positive"
        },
        {
          "field": "Operating Profit (PBDIT) excl Other Income",
          "val1": "-6.50",
          "val2": "-0.37",
          "chgp": "-1,656.76%",
          "chgp_class": "negative"
        },
        {
          "field": "Interest",
          "val1": "11.38",
          "val2": "11.42",
          "chgp": "-0.35%",
          "chgp_class": "positive"
        },
        {
          "field": "Exceptional Items",
          "val1": "0.00",
          "val2": "0.00",
          "chgp": "",
          "chgp_class": "neutral"
        },
        {
          "field": "Standalone Net Profit",
          "val1": "-19.64",
          "val2": "-12.13",
          "chgp": "-61.91%",
          "chgp_class": "negative"
        },
        {
          "field": "Operating Profit Margin (Excl OI)",
          "val1": "-1.95%",
          "val2": "-0.13%",
          "chgp": "-1.82%",
          "chgp_class": "negative"
        }
      ]
    }
  }
]

Quarterly Results Snapshot (Standalone) - Jun'26 - QoQstock-summary

Jun'26
Mar'26
Change(%)
Net Sales
123.42
106.31
16.09%
Operating Profit (PBDIT) excl Other Income
5.85
4.49
30.29%
Interest
2.59
2.82
-8.16%
Exceptional Items
0.00
0.00
Standalone Net Profit
1.28
-2.80
145.71%
Operating Profit Margin (Excl OI)
4.74%
4.22%
0.52%
Values in Rs Cr.
Direction Arrows
Net Sales

QoQ Growth in quarter ended Jun 2026 is 16.09% vs 38.46% in Mar 2026

Direction Arrows
Standalone Net Profit

QoQ Growth in quarter ended Jun 2026 is 145.71% vs 45.10% in Mar 2026

Half Yearly Results Snapshot (Standalone) - Sep'25stock-summary

Sep'25
Sep'24
Change(%)
Net Sales
150.72
122.23
23.31%
Operating Profit (PBDIT) excl Other Income
-7.91
-0.01
-79,000.00%
Interest
5.65
5.10
10.78%
Exceptional Items
0.00
0.00
Standalone Net Profit
-11.74
-5.64
-108.16%
Operating Profit Margin (Excl OI)
-5.25%
-0.01%
-5.24%
Values in Rs Cr.
Direction Arrows
Net Sales

Growth in half year ended Sep 2025 is 23.31% vs -11.34% in Sep 2024

Direction Arrows
Standalone Net Profit

Growth in half year ended Sep 2025 is -108.16% vs -1,381.82% in Sep 2024

Nine Monthly Results Snapshot (Standalone) - Dec'25stock-summary

Dec'25
Dec'24
Change(%)
Net Sales
227.50
184.85
23.07%
Operating Profit (PBDIT) excl Other Income
-11.00
-1.07
-928.04%
Interest
8.57
7.92
8.21%
Exceptional Items
0.00
0.00
Standalone Net Profit
-16.84
-9.31
-80.88%
Operating Profit Margin (Excl OI)
-4.83%
-0.58%
-4.25%
Values in Rs Cr.
Direction Arrows
Net Sales

YoY Growth in nine months ended Dec 2025 is 23.07% vs -7.21% in Dec 2024

Direction Arrows
Standalone Net Profit

YoY Growth in nine months ended Dec 2025 is -80.88% vs -1,263.75% in Dec 2024

Annual Results Snapshot (Standalone) - Mar'26stock-summary

Mar'26
Mar'25
Change(%)
Net Sales
333.81
277.89
20.12%
Operating Profit (PBDIT) excl Other Income
-6.50
-0.37
-1,656.76%
Interest
11.38
11.42
-0.35%
Exceptional Items
0.00
0.00
Standalone Net Profit
-19.64
-12.13
-61.91%
Operating Profit Margin (Excl OI)
-1.95%
-0.13%
-1.82%
Values in Rs Cr.
Direction Arrows
Net Sales

YoY Growth in year ended Mar 2026 is 20.12% vs 1.26% in Mar 2025

Direction Arrows
Standalone Net Profit

YoY Growth in year ended Mar 2026 is -61.91% vs -1,447.78% in Mar 2025

stock-summaryCompany CV
About Malu Paper Mills Ltd stock-summary
stock-summary
Malu Paper Mills Ltd
Micro Cap
Paper, Forest & Jute Products
Malu Paper Mills Limited was incorporated in 1994. The Company is promoted by the "The Malu Family". The Group is having interest in Steam Coal Trading , Manufacturing of Welding Electrodes , Manganese Processing, Steel Castings & Exports; since last three decades. The Company is engaged in Manufacturing Newsprint, Writing & Printing Paper and Kraft Paper.
Company Coordinates stock-summary
Company Details
Heera Plaza 4th Floor, Nr Telephne Exchange Centl Ave Nagpur Maharashtra : 440008
stock-summary
Tel: 91-712-2760308
stock-summary
info@malupaper.com
Registrar Details
Link Intime India Pvt Ltd, C-13 Pannalal Silk Compound, L B S Marg, Bhandup , Mumbai