
Compare Winsome Yarns with Similar Stocks
Dashboard
Weak Long Term Fundamental Strength as the company has not declared results in the last 6 months
- Poor long term growth as Net Sales has grown by an annual rate of -55.90% and Operating profit at 0% over the last 5 years
- The company has a negative book value of Rs 437.21 crore
Flat results in Jan 70
Risky - No result in last 6 months
95.03% of Promoter Shares are Pledged
Stock DNA
Garments & Apparels
INR 17 Cr (Micro Cap)
NA (Loss Making)
25
0.00%
-1.17
3.96%
-0.03
Total Returns (Price + Dividend) 
Latest dividend: 0.0400 per share ex-dividend date: Sep-17-2008
Risk Adjusted Returns v/s
Returns Beta

News
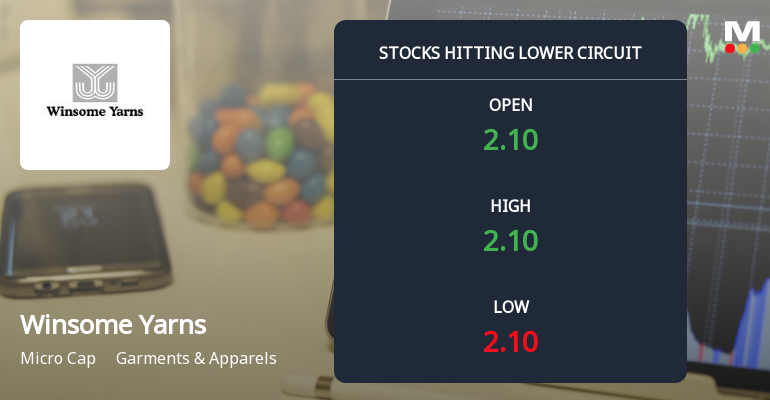
Below All Moving Averages and Now at Lower Circuit: Winsome Yarns Ltd Loses 1.7% in a Single Session
At Rs 2.33, sellers were still queuing — but there were no buyers willing to take the other side. Winsome Yarns Ltd locked at its lower circuit of 1.69% on 29 Jun 2026, with unfilled sell orders and a frozen price that capped losses for the day.
Read full news article
Winsome Yarns Ltd Locks at Lower Circuit With 1.66% Loss — Sellers Queue, No Buyers in Sight
At Rs 2.37, sellers were still queuing — but there were no buyers willing to take the other side. Winsome Yarns Ltd locked at its lower circuit of 1.66% on 24 Jun 2026, with unfilled sell orders and a frozen price, signalling persistent selling pressure in a micro-cap stock with limited liquidity.
Read full news article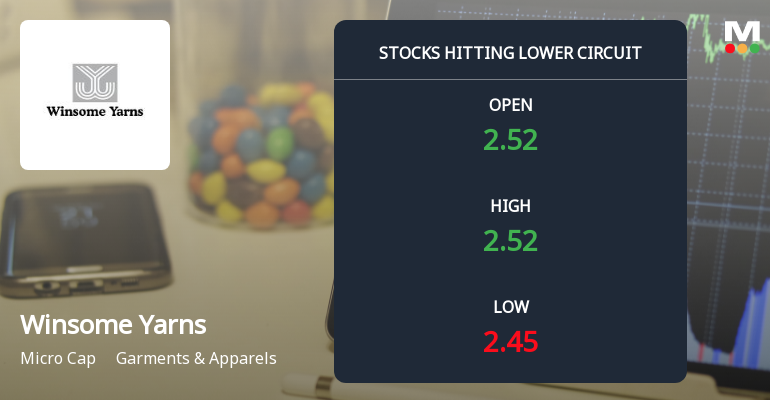
Below All Moving Averages and Now at Lower Circuit: Winsome Yarns Ltd Loses 2.0% in a Single Session
At Rs 2.45, sellers were still queuing — but there were no buyers willing to take the other side. Winsome Yarns Ltd locked at its lower circuit of 2.0% on 19 Jun 2026, with unfilled sell orders and a frozen price, reflecting persistent selling pressure in a micro-cap stock with limited liquidity.
Read full news article Announcements
Announcement under Regulation 30 (LODR)-Change in Management
23-Jun-2026 | Source : BSEIntimation of Appointment of Directors
Delay In Financial Results
01-Jun-2026 | Source : BSEReason for delay in submission of Audited Financial Results for quarter and year ended on 31.03.2026 in terms of SEBI (LODR) Regulations 2015
Compliances-Reg.24(A)-Annual Secretarial Compliance
30-May-2026 | Source : BSECompliance under Regulation 24(A) of SEBI (LODR) Regulations 2015
Corporate Actions

No Upcoming Board Meetings

Winsome Yarns Ltd has declared 1% dividend, ex-date: 17 Sep 08

Winsome Yarns Ltd has announced 10:1 stock split, ex-date: 04 Aug 11

No Bonus history available

No Rights history available
Quality key factors
Valuation key factors
Technicals key factors
 Technical Indicator Scale: Bearish, Mildly Bearish, Sideways, Mildly Bullish, Bullish Turned
 Shareholding Snapshot : Mar 2026
Shareholding Compare (%holding)
Non Institution
95.0255
Held by 2 Schemes (0.02%)
Held by 1 FIIs (1.96%)
Shell Business Private Limited (30.28%)
National Stock Exchange Of India Limited Account Fpi (4.2%)
35.36%
Quarterly Results Snapshot (Standalone) - Mar'25 - QoQ

QoQ Growth in quarter ended Mar 2025 is -31.58% vs -21.92% in Dec 2024
QoQ Growth in quarter ended Mar 2025 is 6.15% vs 23.08% in Dec 2024
Half Yearly Results Snapshot (Standalone) - Sep'24
Growth in half year ended Sep 2024 is -86.89% vs -8.51% in Sep 2023
Growth in half year ended Sep 2024 is -65.65% vs 48.06% in Sep 2023
Nine Monthly Results Snapshot (Standalone) - Dec'24
YoY Growth in nine months ended Dec 2024 is -86.37% vs -12.25% in Dec 2023
YoY Growth in nine months ended Dec 2024 is -50.72% vs 61.34% in Dec 2023
Annual Results Snapshot (Standalone) - Mar'25
YoY Growth in year ended Mar 2025 is -83.52% vs -17.78% in Mar 2024
YoY Growth in year ended Mar 2025 is -58.14% vs 58.59% in Mar 2024
About Winsome Yarns Ltd

Company Coordinates


