
Compare Cerebra Integr. with Similar Stocks
Dashboard
With a Operating Losses, the company has a Weak Long Term Fundamental Strength
- Company's ability to service its debt is weak with a poor EBIT to Interest (avg) ratio of -2.68
- The company has been able to generate a Return on Equity (avg) of 2.35% signifying low profitability per unit of shareholders funds
The company has declared Negative results for the last 6 consecutive quarters
Risky - Negative EBITDA
Below par performance in long term as well as near term
Stock DNA
IT - Hardware
INR 41 Cr (Micro Cap)
NA (Loss Making)
36
0.00%
0.47
-66.42%
0.47
Total Returns (Price + Dividend) 
Cerebra Integr. for the last several years.
Risk Adjusted Returns v/s
Returns Beta

News
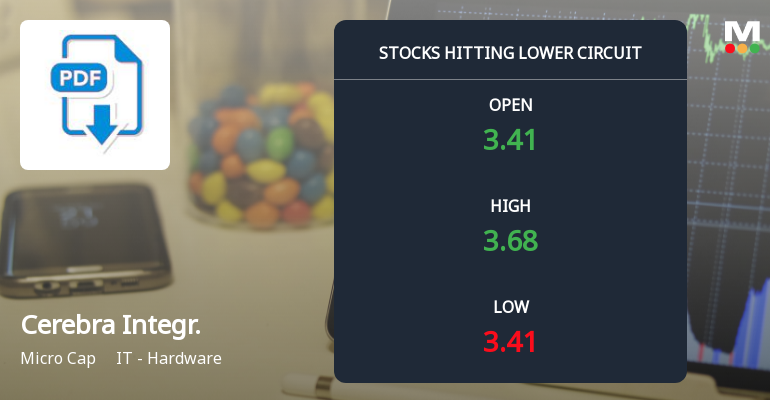
Cerebra Integrated Technologies Ltd Locks at Lower Circuit With 4.82% Loss — Sellers Queue, No Buyers in Sight
At Rs 3.36, sellers were still queuing — but there were no buyers willing to take the other side. Cerebra Integrated Technologies Ltd locked at its lower circuit of 4.82% on 30 Jun 2026, with unfilled sell orders and a frozen price.
Read full news article
Cerebra Integrated Technologies Ltd is Rated Strong Sell
Cerebra Integrated Technologies Ltd is rated Strong Sell by MarketsMOJO. This rating was last updated on 20 Oct 2025, reflecting a significant reassessment of the stock’s outlook. However, the analysis and financial metrics discussed below are based on the company’s current position as of 18 June 2026, providing investors with the latest insights into its performance and prospects.
Read full news article
Cerebra Integrated Technologies Ltd Locks at Upper Circuit With 3.63% Gain — Buyers Queue, Sellers Absent
At Rs 4.05, the buying was done — not because demand dried up, but because the exchange wouldn't let the stock go any higher. Cerebra Integrated Technologies Ltd locked at its upper circuit of 3.63% on 16 Jun 2026, with buyers queuing and no sellers willing to part with shares.
Read full news article Announcements
Closure of Trading Window
24-Jun-2026 | Source : BSEThe Trading Window for dealing in securities of the Company shall remain closed from Wednesday 1st July 2026 till the expiry of 48 hours after the declaration of the unaudited Financial Results of the Company for the 1st quarter ended June 30 2026.
FILING OF APPLICATION BY CEREBRA INTEGRATED TECHNOLOGIES LIMITED (CORPORATE APPLICANT) TO INITIATE CORPORATE INSOLVENCY RESOLUTION PROCESS (CIRP) UNDER CHAPTER II OF PART II OF THE INSOLVENCY AND BANKRUPTCY CODE 2016.
16-Jun-2026 | Source : BSEPursuant to the provisions of Regulation 30 read with Schedule III Para A of Part A of the SEBI (Listing Obligations and Disclosure Requirements) Regulations 2015 this is to inform you that the Company has filed the Application before NCLT Bengaluru Bench to initiate Corporate Insolvency Resolution Process under Section 10 of the Insolvency and Bankruptcy Code 2016 read with Rule 7 of the Insolvency and Bankruptcy (application to adjudicating authority) Rules 2016.
Shareholder Meeting / Postal Ballot-Scrutinizers Report
09-Jun-2026 | Source : BSEPursuant to the provisions of Regulation 44 of SEBI (Listing Obligations and Disclosure Requirements) Regulations 2015 please find enclosed the voting results (remote e-voting and e-voting at the Extraordinary General Meeting dated 06th June 2026) and Scrutinizers Report on the Resolution passed by the Members at the Extraordinary General Meeting (EGM) held on Saturday June 06 2026 at 11.30 A.M. (IST) through Video Conference (VC) or Other Audio and Visual Means (OAVM)
Corporate Actions

No Upcoming Board Meetings

No Dividend history available

No Splits history available

No Bonus history available

No Rights history available
Quality key factors
Valuation key factors
Technicals key factors
 Technical Indicator Scale: Bearish, Mildly Bearish, Sideways, Mildly Bullish, Bullish Turned
 Shareholding Snapshot : Mar 2026
Shareholding Compare (%holding)
Non Institution
None
Held by 0 Schemes
Held by 1 FIIs (0.0%)
V Ranganathan (0.66%)
Dhanlaxmi Jaswantrai Mehta (4.37%)
75.69%
Quarterly Results Snapshot (Consolidated) - Mar'26 - QoQ

QoQ Growth in quarter ended Mar 2026 is 39.02% vs -62.90% in Dec 2025

QoQ Growth in quarter ended Mar 2026 is -85.97% vs -73.58% in Dec 2025
Half Yearly Results Snapshot (Consolidated) - Sep'25
Growth in half year ended Sep 2025 is -82.11% vs -9.80% in Sep 2024
Growth in half year ended Sep 2025 is 24.00% vs -27.55% in Sep 2024
Nine Monthly Results Snapshot (Consolidated) - Dec'25
YoY Growth in nine months ended Dec 2025 is -85.44% vs -9.98% in Dec 2024
YoY Growth in nine months ended Dec 2025 is -2.43% vs 27.16% in Dec 2024
Annual Results Snapshot (Consolidated) - Mar'26
YoY Growth in year ended Mar 2026 is -83.30% vs -31.47% in Mar 2025
YoY Growth in year ended Mar 2026 is -51.61% vs 2.21% in Mar 2025
About Cerebra Integrated Technologies Ltd

Company Coordinates


