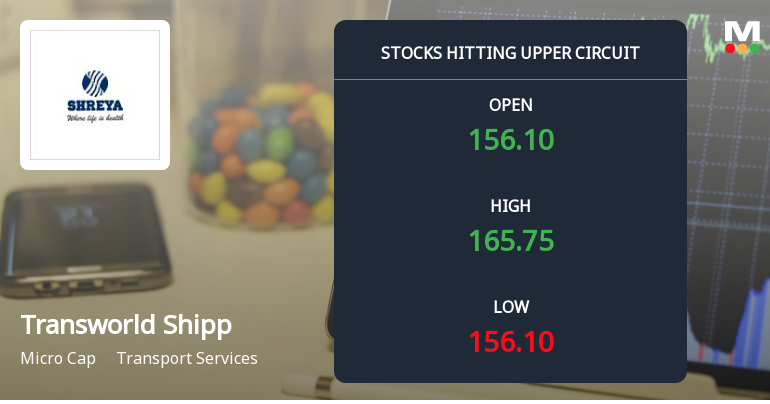
Transworld Shipp

  • Market Cap: Micro Cap
  • Industry: Transport Services
  • ISIN: INE757B01015
  • NSEID: TRANSWORLD
  • BSEID: 520151
INR
165.75
7.85 (4.97%)
BSENSE

Aug 19, 12:47 PM

BSE+NSE Vol: 12.22 k

  • Price Points
  • Score
  • Mojo Parameters
  • Total Return
  • News and Corporate Actions
  • Key factors
  • Shareholding
  • Financials
  • CompanyCV
stock-summaryPrice Point
High/Low

1Day

52 Week

Valuation
Technical
Day's Volume

CASH

12.22 k (134.80%) Volume

Shareholding (Jun 2026)

FII

0.00%

Held by 0 FIIs

DII

0.00%

Held by 0 DIIs

Promoter

70.44%

Why is Transworld Shipping Lines Ltd falling/rising?

19-Aug-2026

As of 18-Aug, the stock price of Transworld Shipping Lines Ltd is at 157.90, showing a significant decline with a year-to-date drop of 20.29% and a one-year decrease of 36.43%. The stock has underperformed its sector and benchmark, with declining investor participation and trading volume indicating a bearish trend.

As of 18-Aug, the stock price of Transworld Shipping Lines Ltd is currently at 157.90, with no change from the previous trading session. The stock has shown a significant decline over various time periods, including a year-to-date drop of 20.29% and a one-year decrease of 36.43%. In comparison to the benchmark Sensex, which has only fallen by 4.97% over the same one-year period, Transworld Shipping Lines Ltd has underperformed considerably.<BR><BR>Today's performance indicates that the stock has underperformed its sector by 2.25%, and it has not traded on one day out of the last twenty, suggesting erratic trading behavior. Additionally, the stock is trading below its moving averages across multiple time frames, including the 5-day, 20-day, 50-day, 100-day, and 200-day averages, which typically signals a bearish trend. <BR><BR>Investor participation appears to be declining, as evidenced by a delivery volume of 435 on 17 August, which is down 36.35% compared to the 5-day average. This decrease in trading activity further indicates a lack of interest or confidence among investors. While the shipping sector as a whole has gained by 2.25%, Transworld Shipping Lines Ltd has not benefited from this sector performance, contributing to its ongoing decline. Overall, the combination of poor stock performance relative to benchmarks, declining trading volume, and lower investor participation are key factors contributing to the stock's downward trend.

View full answer

Who are in the management team of Transworld Shipp?

14-Aug-2026

The management team of Transworld Shipp includes Executive Chairman Ramakrishnan Sivaswamy Iyer, Managing Director Milind Patankar, and several Independent and Non-Executive Directors, responsible for the company's operations and strategic direction.

The management team of Transworld Shipp includes the following individuals:<BR><BR>1. **Ramakrishnan Sivaswamy Iyer** - Executive Chairman<BR>2. **Milind Patankar** - Managing Director<BR>3. **Anisha Ramakrishnan** - Non-Executive & Non-Independent Director<BR>4. **Man Mohan Saggi** - Independent Non-Executive Director<BR>5. **Maya Sinha** - Independent Non-Executive Director<BR>6. **Deepak Shetty** - Independent Non-Executive Director<BR>7. **Ratnagiri Sivaram Krishnan** - Independent Non-Executive Director<BR>8. **Ajit George Paul** - Independent Non-Executive Director<BR><BR>This team is responsible for overseeing the company's operations and strategic direction.

View full answer

What does Transworld Shipp do?

14-Aug-2026

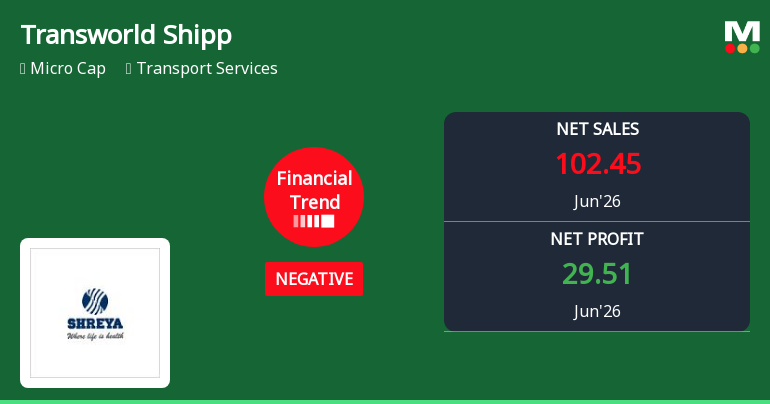
Transworld Shipping Lines Ltd is a micro-cap transport services company, incorporated in 1988, with recent net sales of 102 Cr and net profit of 30 Cr as of June 2026. The company has a market cap of INR 345 Cr and operates with a debt-equity ratio of 0.38.

Overview: <BR>Transworld Shipping Lines Ltd operates in the transport services industry and is categorized as a micro-cap company.<BR><BR>History: <BR>The company was incorporated on August 16, 1988, and has undergone several name changes, with its latest name change to Transworld Shipping Lines Limited effective October 20, 2024. The most recent quarterly results reported net sales and net profit for June 2026.<BR><BR>Financial Snapshot: <BR>Most recent Net Sales: 102 Cr (Quarterly Results - Jun 2026) <BR>Most recent Net Profit: 30 Cr (Quarterly Results - Jun 2026) <BR>Market-cap value: INR 345 Cr (Micro Cap)<BR><BR>Key Metrics: <BR>P/E: N/A <BR>Industry P/E: 7 <BR>Dividend Yield: 0.00% <BR>Debt-Equity: 0.38 <BR>Return on Equity: -11.56% <BR>Price-to-Book: 0.50<BR><BR>Contact Details: <BR>Address: D-301-305 Level 3 Tower II, Grand Central Nerul Node Navi Mumbai Maharashtra : 400706 <BR>Tel: 91-22-68110300 <BR>Email: info@shreyas.co.in <BR>Website: http://www.transworld.com/shreyas

View full answer

Who are the peers of the Transworld Shipp?

14-Aug-2026

Transworld Shipp's peers include Committed Cargo, AVG Logistics, Tara Chand Infra, DJ Mediaprint, OneClick Logisti, Tiger Logistics, Globe Intl. Car., and Lancer Containe. Transworld Shipp has below-average management risk and a 1-year return of -37.62%, lower than its peers, with OneClick Logisti showing the highest return at 76.09%.

Peers: The peers of Transworld Shipp are Committed Cargo, AVG Logistics, Tara Chand Infra, DJ Mediaprint, OneClick Logisti, Tiger Logistics, Globe Intl. Car., and Lancer Containe.<BR><BR>Quality Snapshot: Excellent management risk is observed at Tiger Logistics and DJ Mediaprint, while Average management risk is found at Committed Cargo, Globe Intl. Car., and Tara Chand Infra, and the rest. Below Average management risk is noted at Transworld Shipp, OneClick Logisti, and AVG Logistics. Growth is Excellent at OneClick Logisti, Good at Tiger Logistics and DJ Mediaprint, Below Average at AVG Logistics, Tara Chand Infra, and Transworld Shipp, and the rest. Capital Structure is Excellent at Committed Cargo and Tiger Logistics, Good at OneClick Logisti and DJ Mediaprint, Average at Tara Chand Infra and Lancer Containe, and Below Average at Transworld Shipp and AVG Logistics.<BR><BR>Return Snapshot: The peer with the highest 1-year return is OneClick Logisti at 76.09%, while the lowest is Tara Chand Infra at -33.49%. Transworld Shipp's 1-year return is -37.62%, which is lower than both of these peers. Additionally, the six-month return is negative for Transworld Shipp, Tara Chand Infra, Tiger Logistics, and Globe Intl. Car.

View full answer

How big is Transworld Shipp?

14-Aug-2026

As of 14th August, Transworld Shipping Lines Ltd has a market capitalization of 340.45 Cr, with net sales of 509.94 Cr and a net loss of 36.56 Cr over the latest four quarters. Shareholder's funds are valued at 673.77 Cr, and total assets amount to 1,139.13 Cr.

As of 14th August, Transworld Shipping Lines Ltd has a market capitalization of 340.45 Cr, categorizing it as a Micro Cap company.<BR><BR>In the latest four quarters, the company reported net sales of 509.94 Cr. However, it experienced a loss of 36.56 Cr in net profit during the same period.<BR><BR>The latest reporting period for the balance sheet is March 2026. Shareholder's funds are valued at 673.77 Cr, while total assets amount to 1,139.13 Cr.

View full answer

Should I buy, sell or hold Transworld Shipping Lines Ltd?

08-Aug-2026

When is the next results date for Transworld Shipping Lines Ltd?

30-Jul-2026

The next results date for Transworld Shipping Lines Ltd is August 7, 2026.

The next results date for Transworld Shipping Lines Ltd is scheduled for August 7, 2026.

View full answer

Are Transworld Shipping Lines Ltd latest results good or bad?

21-May-2026

Transworld Shipping Lines Ltd's latest results are concerning, showing a net loss of ₹29.52 crores in Q4 FY26, a 383.93% increase from last year, alongside declining revenues and a collapsing operating margin of 1.97%. The company's financial performance indicates significant operational challenges and ongoing losses, suggesting investors should be cautious.

Transworld Shipping Lines Ltd's latest results are concerning and indicate a company in distress. In the fourth quarter of FY26, the company reported a net loss of ₹29.52 crores, which is a significant increase of 383.93% compared to the same quarter last year. This loss also widened by 16.68% from the previous quarter. <BR><BR>Revenue for the quarter was ₹132.42 crores, showing a slight decline of 0.03% quarter-on-quarter and a more substantial drop of 12.82% year-on-year. The operating margin has collapsed to just 1.97%, the lowest in eight quarters, down from 22.92% in the same quarter last year. This reflects severe operational challenges and rising costs that the company has been unable to manage effectively.<BR><BR>Moreover, the interest coverage ratio has fallen to a distressing 0.44 times, indicating significant difficulties in servicing debt from operational profits. The overall financial performance suggests a downward spiral, with four consecutive quarters of losses and deteriorating margins.<BR><BR>In summary, the results indicate a troubling trend for Transworld Shipping, characterized by increasing losses, declining revenues, and significant operational inefficiencies. Investors should approach this situation with caution.

View full answer

Is Transworld Shipp technically bullish or bearish?

18-Nov-2025

As of November 17, 2025, the market trend is mildly bearish, indicated by mixed signals from the MACD, moving averages, and Bollinger Bands across different timeframes.

As of 17 November 2025, the technical trend has changed from bearish to mildly bearish. The current stance is mildly bearish, driven by several key indicators. The MACD on a weekly basis is mildly bullish, but the monthly MACD remains bearish, indicating mixed signals. The moving averages on a daily timeframe are bearish, which aligns with the overall sentiment. The Dow Theory also reflects a mildly bearish stance on both weekly and monthly charts. The Bollinger Bands are sideways on the weekly chart and bearish on the monthly, further supporting the bearish outlook. The KST is mildly bullish weekly but bearish monthly, adding to the mixed signals. Overall, the strength of the bearish sentiment is moderate, influenced by the daily moving averages and the Dow Theory.

View full answer

How has been the historical performance of Transworld Shipp?

12-Nov-2025

Transworld Shipp's historical performance shows significant revenue fluctuations, with net sales declining from a peak of 624.79 Cr in Mar'19 to 446.27 Cr by Mar'25. However, profitability improved in Mar'25, with profit after tax rebounding to 33.89 Cr and cash flow from operations rising to 168.00 Cr, despite challenges in revenue generation.

Answer:<BR>The historical performance of Transworld Shipp shows significant fluctuations in key financial metrics over the years.<BR><BR>Breakdown:<BR>Transworld Shipp's net sales have varied considerably, peaking at 624.79 Cr in Mar'19 and declining to 446.27 Cr by Mar'25, with a notable drop from 483.78 Cr in Mar'23. Total operating income followed a similar trend, reflecting the same values as net sales. The total expenditure, excluding depreciation, decreased from 569.50 Cr in Mar'20 to 290.15 Cr in Mar'25, indicating improved cost management despite fluctuations in revenue. Operating profit (PBDIT) showed a peak of 265.30 Cr in Mar'23 but fell to 163.81 Cr in Mar'25, while profit before tax turned positive at 35.55 Cr in Mar'25 after a loss of 47.55 Cr in Mar'24. Profit after tax also rebounded to 33.89 Cr in Mar'25 from a loss of 51.02 Cr the previous year. The company's total assets decreased from 1,357.37 Cr in Mar'23 to 1,198.35 Cr in Mar'25, while total liabilities also declined from 1,247.06 Cr to 1,198.35 Cr in the same period. Cash flow from operating activities improved significantly to 168.00 Cr in Mar'25, contrasting with lower figures in prior years, and the closing cash and cash equivalents rose to 19.00 Cr from 7.00 Cr in Mar'24. Overall, the financial data reflects a recovery in profitability and cash flow, despite challenges in revenue generation and asset management.

View full answer

Who are the top shareholders of the Transworld Shipp?

17-Jul-2025

The top shareholders of Transworld Shipping include Transworld Holdings Limited with 56.25%, Gurudev Marketing Pvt. Ltd. at 5.76%, and individual investors holding 23.12%. There are also 5 Foreign Institutional Investors with a combined stake of 0.08%, and no pledged promoter holdings or mutual funds.

The top shareholders of Transworld Shipping include Transworld Holdings Limited, which holds the largest stake at 56.25%. Other significant shareholders are Gurudev Marketing Pvt. Ltd., with a holding of 5.76%, and individual investors collectively owning 23.12%. Additionally, there are 5 Foreign Institutional Investors (FIIs) that hold a small percentage of 0.08%. Notably, there are no pledged promoter holdings or mutual funds involved in the shareholding.

View full answer

Is Transworld Shipp overvalued or undervalued?

09-Jun-2025

As of February 12, 2025, Transworld Shipp is considered very attractive and undervalued with a PE ratio of 13.52, an EV to EBITDA of 5.70, and a PEG ratio of 0.07, outperforming peers like GE Shipping Co and S C I, and showing a remarkable long-term return of 453.12% despite short-term underperformance against the Sensex.

As of 12 February 2025, the valuation grade for Transworld Shipp has moved from attractive to very attractive, indicating a strong improvement in its perceived value. The company is currently considered undervalued based on its financial metrics. Key ratios include a price-to-earnings (PE) ratio of 13.52, an EV to EBITDA of 5.70, and a PEG ratio of 0.07, which suggests significant growth potential relative to its price.<BR><BR>In comparison to its peers, Transworld Shipp stands out favorably against GE Shipping Co, which has a PE ratio of 6.01, and S C I, which has a PE ratio of 11.79. This positions Transworld Shipp as a more attractive investment opportunity within the transport services industry. Additionally, while the stock has underperformed the Sensex in the short term, its long-term performance over five years shows a remarkable return of 453.12%, reinforcing the notion that it may be undervalued at its current price of 297.30.

View full answer

Has Transworld Shipp declared dividend?

06-Jun-2025

Transworld Shipping Lines Ltd has declared a 15% dividend, amounting to 1.5 per share, with an ex-date of September 7, 2023. While the company has declared a dividend, total returns have varied significantly, showing negative returns in the short term and substantial gains over the long term.

Transworld Shipping Lines Ltd has declared a 15% dividend.<BR><BR>Dividend Details:<BR>- Percentage announced: 15%<BR>- Amount per share: 1.5<BR>- Ex-date: 07 Sep 23<BR><BR>Dividend Yield: 0%<BR><BR>Total Returns by Period:<BR>Over the 6-month period, the price return was -37.11%, with a dividend return of 0%, resulting in a total return of -37.11%.<BR><BR>For the 1-year period, the price return was -2.97%, with a dividend return of 0%, leading to a total return of -2.97%.<BR><BR>In the 2-year period, the price return was -10.65%, with a dividend return of 0.46%, culminating in a total return of -10.19%.<BR><BR>During the 3-year period, the price return was -15.71%, with a dividend return of 1.41%, resulting in a total return of -14.3%.<BR><BR>Over the 4-year period, the price return was 36.78%, with a dividend return of 3.29%, leading to a total return of 40.07%.<BR><BR>In the 5-year period, the price return was 449.06%, with a dividend return of 10.08%, resulting in a total return of 459.14%.<BR><BR>Overall, while Transworld Shipping Lines Ltd has declared a dividend, the total returns over various periods indicate significant fluctuations, with negative returns in the shorter terms and substantial positive returns over the longer term.

View full answer
iScoreScore
Click here to find our call on this stock
Strong Sell
Sell
Hold
Buy
Strong Buy

Dashboard

1

With a Operating Losses, the company has a Weak Long Term Fundamental Strength

  • The company has been able to generate a Return on Capital Employed (avg) of 9.77% signifying low profitability per unit of total capital (equity and debt)
2

The company has declared Negative results for the last 4 consecutive quarters

3

Risky - Negative EBITDA

4

Consistent Underperformance against the benchmark over the last 3 years

stock-summaryMojo Parameters

Mojo Parameters

Loading Valuation Snapshot...

Stock DNA

stock-summary
Industry

Transport Services

stock-summary
Market cap

INR 364 Cr (Micro Cap)

stock-summary
P/E

NA (Loss Making)

stock-summary
Industry P/E

7

stock-summary
Dividend Yield

0.00%

stock-summary
Debt Equity

0.38

stock-summary
Return on Equity

-11.56%

stock-summary
Price to Book

0.51

Revenue and Profits:
Net Sales:
102 Cr
(Quarterly Results - Jun 2026)
Net Profit:
30 Cr
stock-summaryTotal Returns
Total Returns (Price + Dividend) stock-summary
Dividend Yield (0%)
TimePeriod
Price Return
Dividend Return
Total Return
3 Months
-1.31%
0%
-1.31%
6 Months
4.77%
0%
4.77%
1 Year
-36.77%
0%
-36.77%
2 Years
-50.78%
0.46%
-50.32%
3 Years
-50.52%
0.89%
-49.63%
4 Years
-47.69%
1.47%
-46.22%
5 Years
-36.99%
1.96%
-35.03%

Latest dividend: 1.5 per share ex-dividend date: Jul-25-2025

Risk Adjusted Returns v/s stock-summary
Returns Beta
Icon
Beta has not been calculated since enough price history is not available
stock-summaryNews & Corporate Actions

Announcements stock-summary

Sale Of Vessel M.V. SSL Kaveri

17-Aug-2026 | Source : BSE

Sale of Vessel M.V. SSL Kaveri

Signing Of Memorandum Of Agreement

13-Aug-2026 | Source : BSE

Signing of Memorandum of Agreement

Announcement under Regulation 30 (LODR)-Newspaper Publication

08-Aug-2026 | Source : BSE

Submission of Newspaper Advertisement published in connection with Unaudited Financial Results (Standalone and Consolidated) for the quarter ended 30th June 2026

Corporate Actions stock-summary

stock-summary
BOARD MEETING

No Upcoming Board Meetings

stock-summary
DIVIDEND

Transworld Shipping Lines Ltd has declared 15% dividend, ex-date: 25 Jul 25

stock-summary
SPLITS

No Splits history available

stock-summary
BONUS

No Bonus history available

stock-summary
RIGHTS

No Rights history available

stock-summaryKey Factors

Quality key factors stock-summary

Factor
Value
Sales Growth (5y)
-4.39%
EBIT Growth (5y)
-206.40%
EBIT to Interest (avg)
3.91
Debt to EBITDA (avg)
4.24
Net Debt to Equity (avg)
0.38
Sales to Capital Employed (avg)
0.49
Tax Ratio
11.36%
Dividend Payout Ratio
9.72%
Pledged Shares
0
Institutional Holding
0
ROCE (avg)
9.35%
ROE (avg)
12.46%

Valuation key factors

Factor
Value
P/E Ratio
NA (Loss Making)
Industry P/E
7
Price to Book Value
0.51
EV to EBIT
-4.84
EV to EBITDA
-21.62
EV to Capital Employed
0.65
EV to Sales
1.18
PEG Ratio
NA
Dividend Yield
NA
ROCE (Latest)
-6.13%
ROE (Latest)
-11.56%

Technicals key factors

Indicator
Weekly
Monthly
MACD
Mildly Bullish
Bearish
RSI
No Signal
No Signal
Bollinger Bands
Mildly Bearish
Bearish
Moving Averages
Bearish (Daily)
KST
Mildly Bearish
Bearish
Dow Theory
Mildly Bearish
Mildly Bearish
OBV
No Trend
Mildly Bullish
stock-summary Technical Indicator Scale: Bearish, Mildly Bearish, Sideways, Mildly Bullish, Bullish  Turned 
stock-summaryShareholding
Shareholding Snapshot : Jun 2026stock-summary
Shareholding Compare (%holding) stock-summary
Majority shareholders

Promoters

Pledged Promoter Holdings

None

Mutual Funds

Held by 0 Schemes

FIIs

Held by 0 FIIs

Promoter with highest holding

Transworld Holdings Limited (56.25%)

Highest Public shareholder

Ramesh Damani (1.13%)

Individual Investors Holdings

22.73%

stock-summaryFinancial
[
  {
    "link": "quarterly",
    "btn_text": "All Quarterly Results",
    "header": "Quarterly Results Snapshot (Consolidated) - Jun'26 - QoQ",
    "rhs": [
      {
        "prefix": "Net Sales ",
        "suffix": "QoQ Growth in quarter ended Jun 2026 is -22.63% vs -0.03% in Mar 2026",
        "dir": -1
      },
      {
        "prefix": "Consolidated Net Profit ",
        "suffix": "QoQ Growth in quarter ended Jun 2026 is 199.97% vs -16.68% in Mar 2026",
        "dir": 1
      }
    ],
    "table": {
      "header": [
        "Jun'26",
        "Mar'26",
        "Change(%)"
      ],
      "body": [
        {
          "field": "Net Sales",
          "val1": "102.45",
          "val2": "132.42",
          "chgp": "-22.63%",
          "chgp_class": "negative"
        },
        {
          "field": "Operating Profit (PBDIT) excl Other Income",
          "val1": "-52.11",
          "val2": "2.61",
          "chgp": "-2,096.55%",
          "chgp_class": "negative"
        },
        {
          "field": "Interest",
          "val1": "5.85",
          "val2": "5.93",
          "chgp": "-1.35%",
          "chgp_class": "positive"
        },
        {
          "field": "Exceptional Items",
          "val1": "0.00",
          "val2": "-1.17",
          "chgp": "100.00%",
          "chgp_class": "positive"
        },
        {
          "field": "Consolidate Net Profit",
          "val1": "29.51",
          "val2": "-29.52",
          "chgp": "199.97%",
          "chgp_class": "positive"
        },
        {
          "field": "Operating Profit Margin (Excl OI)",
          "val1": "-50.86%",
          "val2": "1.97%",
          "chgp": "-52.83%",
          "chgp_class": "negative"
        }
      ]
    }
  },
  {
    "link": "half-yearly",
    "btn_text": "All Half Yearly Results",
    "header": "Half Yearly Results Snapshot (Consolidated) - Sep'25",
    "rhs": [
      {
        "prefix": "Net Sales ",
        "suffix": " Growth in half year ended Sep 2025 is -11.73% vs 80.66% in Sep 2024",
        "dir": -1
      },
      {
        "prefix": "Consolidated Net Profit ",
        "suffix": " Growth in half year ended Sep 2025 is -172.99% vs 168.56% in Sep 2024",
        "dir": -1
      }
    ],
    "table": {
      "header": [
        "Sep'25",
        "Sep'24",
        "Change(%)"
      ],
      "body": [
        {
          "field": "Net Sales",
          "val1": "192.98",
          "val2": "218.62",
          "chgp": "-11.73%",
          "chgp_class": "negative"
        },
        {
          "field": "Operating Profit (PBDIT) excl Other Income",
          "val1": "34.04",
          "val2": "77.06",
          "chgp": "-55.83%",
          "chgp_class": "negative"
        },
        {
          "field": "Interest",
          "val1": "12.02",
          "val2": "16.20",
          "chgp": "-25.80%",
          "chgp_class": "positive"
        },
        {
          "field": "Exceptional Items",
          "val1": "3.98",
          "val2": "0.00",
          "chgp": "",
          "chgp_class": "neutral"
        },
        {
          "field": "Consolidate Net Profit",
          "val1": "-16.97",
          "val2": "23.25",
          "chgp": "-172.99%",
          "chgp_class": "negative"
        },
        {
          "field": "Operating Profit Margin (Excl OI)",
          "val1": "17.64%",
          "val2": "35.25%",
          "chgp": "-17.61%",
          "chgp_class": "negative"
        }
      ]
    }
  },
  {
    "link": "nine-monthly",
    "btn_text": "All Nine Monthly Results",
    "header": "Nine Monthly Results Snapshot (Consolidated) - Dec'25",
    "rhs": [
      {
        "prefix": "Net Sales ",
        "suffix": "YoY Growth in nine months ended Dec 2025 is -15.24% vs 99.17% in Dec 2024",
        "dir": -1
      },
      {
        "prefix": "Consolidated Net Profit ",
        "suffix": "YoY Growth in nine months ended Dec 2025 is -211.21% vs 171.19% in Dec 2024",
        "dir": -1
      }
    ],
    "table": {
      "header": [
        "Dec'25",
        "Dec'24",
        "Change(%)"
      ],
      "body": [
        {
          "field": "Net Sales",
          "val1": "325.44",
          "val2": "383.94",
          "chgp": "-15.24%",
          "chgp_class": "negative"
        },
        {
          "field": "Operating Profit (PBDIT) excl Other Income",
          "val1": "40.21",
          "val2": "122.03",
          "chgp": "-67.05%",
          "chgp_class": "negative"
        },
        {
          "field": "Interest",
          "val1": "18.64",
          "val2": "25.50",
          "chgp": "-26.90%",
          "chgp_class": "positive"
        },
        {
          "field": "Exceptional Items",
          "val1": "3.98",
          "val2": "0.00",
          "chgp": "",
          "chgp_class": "neutral"
        },
        {
          "field": "Consolidate Net Profit",
          "val1": "-42.27",
          "val2": "38.01",
          "chgp": "-211.21%",
          "chgp_class": "negative"
        },
        {
          "field": "Operating Profit Margin (Excl OI)",
          "val1": "12.36%",
          "val2": "31.78%",
          "chgp": "-19.42%",
          "chgp_class": "negative"
        }
      ]
    }
  },
  {
    "link": "annual",
    "btn_text": "All Annual Results",
    "header": "Annual Results Snapshot (Consolidated) - Mar'26",
    "rhs": [
      {
        "prefix": "Net Sales ",
        "suffix": "YoY Growth in year ended Mar 2026 is -15.59% vs 130.04% in Mar 2025",
        "dir": -1
      },
      {
        "prefix": "Consolidated Net Profit ",
        "suffix": "YoY Growth in year ended Mar 2026 is -368.74% vs 154.75% in Mar 2025",
        "dir": -1
      }
    ],
    "table": {
      "header": [
        "Mar'26",
        "Mar'25",
        "Change(%)"
      ],
      "body": [
        {
          "field": "Net Sales",
          "val1": "548.31",
          "val2": "649.61",
          "chgp": "-15.59%",
          "chgp_class": "negative"
        },
        {
          "field": "Operating Profit (PBDIT) excl Other Income",
          "val1": "43.37",
          "val2": "155.02",
          "chgp": "-72.02%",
          "chgp_class": "negative"
        },
        {
          "field": "Interest",
          "val1": "26.19",
          "val2": "34.69",
          "chgp": "-24.50%",
          "chgp_class": "positive"
        },
        {
          "field": "Exceptional Items",
          "val1": "2.81",
          "val2": "-13.41",
          "chgp": "120.95%",
          "chgp_class": "positive"
        },
        {
          "field": "Consolidate Net Profit",
          "val1": "-75.06",
          "val2": "27.93",
          "chgp": "-368.74%",
          "chgp_class": "negative"
        },
        {
          "field": "Operating Profit Margin (Excl OI)",
          "val1": "7.91%",
          "val2": "23.86%",
          "chgp": "-15.95%",
          "chgp_class": "negative"
        }
      ]
    }
  }
]

Quarterly Results Snapshot (Consolidated) - Jun'26 - QoQstock-summary

Jun'26
Mar'26
Change(%)
Net Sales
102.45
132.42
-22.63%
Operating Profit (PBDIT) excl Other Income
-52.11
2.61
-2,096.55%
Interest
5.85
5.93
-1.35%
Exceptional Items
0.00
-1.17
100.00%
Consolidate Net Profit
29.51
-29.52
199.97%
Operating Profit Margin (Excl OI)
-50.86%
1.97%
-52.83%
Values in Rs Cr.
Direction Arrows
Net Sales

QoQ Growth in quarter ended Jun 2026 is -22.63% vs -0.03% in Mar 2026

Direction Arrows
Consolidated Net Profit

QoQ Growth in quarter ended Jun 2026 is 199.97% vs -16.68% in Mar 2026

Half Yearly Results Snapshot (Consolidated) - Sep'25stock-summary

Sep'25
Sep'24
Change(%)
Net Sales
192.98
218.62
-11.73%
Operating Profit (PBDIT) excl Other Income
34.04
77.06
-55.83%
Interest
12.02
16.20
-25.80%
Exceptional Items
3.98
0.00
Consolidate Net Profit
-16.97
23.25
-172.99%
Operating Profit Margin (Excl OI)
17.64%
35.25%
-17.61%
Values in Rs Cr.
Direction Arrows
Net Sales

Growth in half year ended Sep 2025 is -11.73% vs 80.66% in Sep 2024

Direction Arrows
Consolidated Net Profit

Growth in half year ended Sep 2025 is -172.99% vs 168.56% in Sep 2024

Nine Monthly Results Snapshot (Consolidated) - Dec'25stock-summary

Dec'25
Dec'24
Change(%)
Net Sales
325.44
383.94
-15.24%
Operating Profit (PBDIT) excl Other Income
40.21
122.03
-67.05%
Interest
18.64
25.50
-26.90%
Exceptional Items
3.98
0.00
Consolidate Net Profit
-42.27
38.01
-211.21%
Operating Profit Margin (Excl OI)
12.36%
31.78%
-19.42%
Values in Rs Cr.
Direction Arrows
Net Sales

YoY Growth in nine months ended Dec 2025 is -15.24% vs 99.17% in Dec 2024

Direction Arrows
Consolidated Net Profit

YoY Growth in nine months ended Dec 2025 is -211.21% vs 171.19% in Dec 2024

Annual Results Snapshot (Consolidated) - Mar'26stock-summary

Mar'26
Mar'25
Change(%)
Net Sales
548.31
649.61
-15.59%
Operating Profit (PBDIT) excl Other Income
43.37
155.02
-72.02%
Interest
26.19
34.69
-24.50%
Exceptional Items
2.81
-13.41
120.95%
Consolidate Net Profit
-75.06
27.93
-368.74%
Operating Profit Margin (Excl OI)
7.91%
23.86%
-15.95%
Values in Rs Cr.
Direction Arrows
Net Sales

YoY Growth in year ended Mar 2026 is -15.59% vs 130.04% in Mar 2025

Direction Arrows
Consolidated Net Profit

YoY Growth in year ended Mar 2026 is -368.74% vs 154.75% in Mar 2025

stock-summaryCompany CV
About Transworld Shipping Lines Ltd stock-summary
stock-summary
Transworld Shipping Lines Ltd
Micro Cap
Transport Services
Transworld Shipping Lines Limited, formerly known as 'Shreyas Shipping Limited' was established on August 16, 1988. The Company's name changed from "Shreyas Shipping Limited" to "Shreyas Shipping & Logistics Limited" on November 21, 2005 and thereafter has changed to 'Transworld Shipping Lines Limited' on September 23, 2024.
Company Coordinates stock-summary
Company Details
D-301-305 Level 3 Tower II, Grand Central Nerul Node Navi Mumbai Maharashtra : 400706
stock-summary
Tel: 91-22-68110300
stock-summary
info@shreyas.co.in
Registrar Details
Link Intime India Pvt Ltd, C-13 Pannalal Silk Compound, L B S Marg, Bhandup , Mumbai