
Compare AVG Logistics with Similar Stocks
Stock DNA
Transport Services
INR 338 Cr (Micro Cap)
16.00
36
0.54%
1.05
8.10%
1.31
Total Returns (Price + Dividend) 
Latest dividend: 1.1472385631318562 per share ex-dividend date: Sep-23-2025
Risk Adjusted Returns v/s
Returns Beta

News

AVG Logistics Ltd is Rated Sell
AVG Logistics Ltd is rated Sell by MarketsMOJO, with this rating last updated on 23 June 2025. However, the analysis and financial metrics discussed here reflect the stock's current position as of 11 June 2026, providing investors with an up-to-date perspective on the company’s performance and outlook.
Read full news article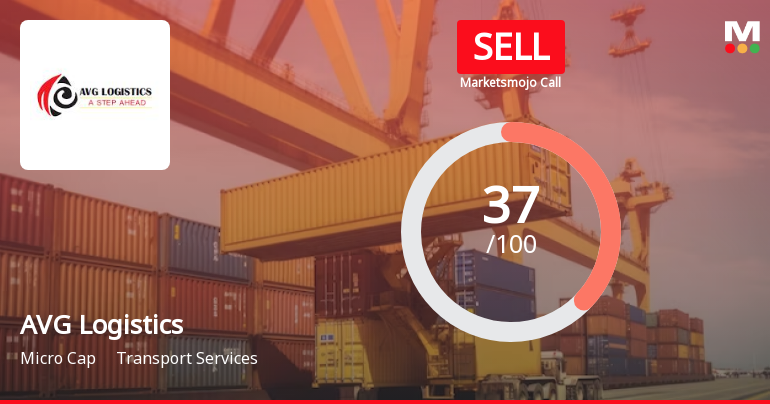
AVG Logistics Ltd is Rated Sell
AVG Logistics Ltd is rated Sell by MarketsMOJO, with this rating last updated on 23 June 2025. However, the analysis and financial metrics discussed here reflect the stock’s current position as of 30 May 2026, providing investors with an up-to-date view of the company’s fundamentals, returns, and market performance.
Read full news article Announcements
Update
18-Jun-2026 | Source : BSEDetailed reason for delay in submission of Financial results for the quarter and year ended March 31 2026
Disclosures under Reg. 29(1) of SEBI (SAST) Regulations 2011
15-Jun-2026 | Source : BSEThe Exchange has received the disclosure under Regulation 29(1) of SEBI (Substantial Acquisition of Shares & Takeovers) Regulations 2011 for Sixth Sense India Opportunities IV & Others
Disclosures under Reg. 29(2) of SEBI (SAST) Regulations 2011
15-Jun-2026 | Source : BSEThe Exchange has received the disclosure under Regulation 29(2) of SEBI (Substantial Acquisition of Shares & Takeovers) Regulations 2011 for Sanjay Gupta
Corporate Actions

No Upcoming Board Meetings

AVG Logistics Ltd has declared 12% dividend, ex-date: 23 Sep 25

No Splits history available

No Bonus history available

AVG Logistics Ltd has announced 8:33 rights issue, ex-date: 21 May 26
Quality key factors
Valuation key factors
Technicals key factors
 Technical Indicator Scale: Bearish, Mildly Bearish, Sideways, Mildly Bullish, Bullish Turned
 Shareholding Snapshot : Jun 2026
Shareholding Compare (%holding)
Promoters
66.7117
Held by 0 Schemes
Held by 7 FIIs (5.9%)
Asha Gupta (29.31%)
Sixth Sense India Opportunities Iv (15.78%)
26.76%
Quarterly Results Snapshot (Consolidated) - Dec'25 - YoY

YoY Growth in quarter ended Dec 2025 is -5.87% vs 14.16% in Dec 2024
YoY Growth in quarter ended Dec 2025 is -2.00% vs 14.79% in Dec 2024
Half Yearly Results Snapshot (Consolidated) - Sep'25
Growth in half year ended Sep 2025 is 2.56% vs 20.02% in Sep 2024
Growth in half year ended Sep 2025 is -5.00% vs 149.18% in Sep 2024
Nine Monthly Results Snapshot (Consolidated) - Dec'25
YoY Growth in nine months ended Dec 2025 is -0.42% vs 17.89% in Dec 2024
YoY Growth in nine months ended Dec 2025 is -3.98% vs 77.90% in Dec 2024
Annual Results Snapshot (Consolidated) - Mar'25

YoY Growth in year ended Mar 2025 is 14.93% vs 12.36% in Mar 2024
YoY Growth in year ended Mar 2025 is -33.18% vs 282.73% in Mar 2024
About AVG Logistics Ltd

Company Coordinates


