Aditya Bir. Fas.

  • Market Cap: Small Cap
  • Industry: Garments & Apparels
  • ISIN: INE647O01011
  • NSEID: ABFRL
  • BSEID: 535755
INR
60.22
-0.37 (-0.61%)
BSENSE

Jun 23, 11:00 AM

BSE+NSE Vol: 8.6 lacs

  • Price Points
  • Score
  • Mojo Parameters
  • Total Return
  • News and Corporate Actions
  • Key factors
  • Shareholding
  • Financials
  • CompanyCV
stock-summaryPrice Point
High/Low

1Day

52 Week

Valuation
Technical
Day's Volume

CASH

8.6 lacs (-44.26%) Volume

Shareholding (Mar 2026)

FII

15.52%

Held by 182 FIIs

DII

6.62%

Held by 39 DIIs

Promoter

46.61%

Why is Aditya Birla Fashion & Retail Ltd falling/rising?

23-Jun-2026

As of 22-Jun, Aditya Birla Fashion & Retail Ltd's stock price is declining, currently at 60.59, with a year-to-date drop of 21.06% and significant underperformance compared to the Sensex. Weak fundamentals, including a low ROCE and high Debt to EBITDA ratio, along with decreasing investor interest, contribute to this bearish trend.

As of 22-Jun, Aditya Birla Fashion & Retail Ltd's stock price is falling, currently at 60.59, reflecting a change of -0.23 (-0.38%). The stock has been underperforming significantly compared to the benchmark Sensex, which has risen by 1.09% over the past week while the stock itself has decreased by 0.70%. Over the past month, the stock has experienced a decline of 10.25%, contrasting sharply with the Sensex's increase of 2.23%. Year-to-date, the stock is down 21.06%, while the Sensex has only fallen by 9.54%.<BR><BR>The stock has been on a consecutive decline for the last three days, with a total drop of 1.68% during this period. It is also trading below all its moving averages, including the 5-day, 20-day, 50-day, 100-day, and 200-day averages, indicating a bearish trend. Additionally, there has been a decrease in investor participation, with delivery volume falling by 5.21% against the 5-day average.<BR><BR>The company's fundamentals are weak, evidenced by a low Return on Capital Employed (ROCE) of 0.93% and a high Debt to EBITDA ratio of 9.01 times, indicating a poor ability to service debt. The company reported a negative EBIT of Rs. -652.87 crore, and its profits have declined by 3.9% over the past year, contributing to the stock's negative performance. Overall, the combination of poor financial health, declining investor interest, and underperformance relative to the market has led to the stock's falling price.

View full answer

How big is Aditya Bir. Fas.?

11-Jun-2026

As of 10th June, Aditya Birla Fashion & Retail Ltd has a market capitalization of 7,424.00 Cr and reported net sales of 8,176.91 Cr with a net loss of 775.94 Cr over the last four quarters.

As of 10th June, <BR><BR>Market Cap: Aditya Birla Fashion & Retail Ltd has a market capitalization of 7,424.00 Cr, categorizing it as a Small Cap company.<BR><BR>Recent Quarterly Performance: The sum of Net Sales for the latest 4 quarters is 8,176.91 Cr, while the sum of Net Profit for the same period reflects a loss of 775.94 Cr.<BR><BR>Balance Sheet Snapshot: The reporting period for the balance sheet is March 2025. Shareholder's Funds stand at 6,812.17 Cr, and Total Assets amount to 16,393.97 Cr.

View full answer

Who are in the management team of Aditya Bir. Fas.?

11-Jun-2026

The management team of Aditya Bir. Fas. includes Kumar Mangalam Birla as Chairman, along with key members such as Ashish Dikshit and Sangeeta Sandeep Pendurkar as Executive Directors, and several Independent Non-Executive Directors, ensuring a diverse leadership structure.

The management team of Aditya Bir. Fas. includes the following key members:<BR><BR>1. **Kumar Mangalam Birla** - Chairman (Non-Executive) & Director (Non-Independent)<BR>2. **Aryaman Birla** - Non-Executive & Non-Independent Director<BR>3. **Ananyashree Birla** - Non-Executive & Non-Independent Director<BR>4. **Arun Kumar Adhikari** - Independent Non-Executive Director<BR>5. **Nish Bhutani** - Independent Non-Executive Director<BR>6. **Preeti Vyas** - Independent Non-Executive Director<BR>7. **Sukanya Kripalu** - Independent Non-Executive Director<BR>8. **Sunirmal Talukdar** - Independent Non-Executive Director<BR>9. **Vikram Rao** - Non-Executive & Non-Independent Director<BR>10. **Yogesh Chaudhary** - Independent Non-Executive Director<BR>11. **Pankaj Sood** - Non-Executive Director / Nominee<BR>12. **Ashish Dikshit** - Executive Director & Managing Director<BR>13. **Sangeeta Sandeep Pendurkar** - Executive Director & Whole-time Director<BR>14. **Vishak Kumar** - Executive Director & Whole-time Director<BR><BR>This diverse team brings a mix of executive and independent perspectives to the company's leadership.

View full answer

Who are the peers of the Aditya Bir. Fas.?

11-Jun-2026

Aditya Bir. Fas. peers include Arvind Ltd, Trident, Vedant Fashions, V2 Retail, Pearl Global Ind, Garware Tech, Indo Count Inds., Arvind Fashions, and Alok Industries. Aditya Bir. Fas. has average management risk and a 1-year return of -23.72%, higher than Vedant Fashions but lower than Arvind Ltd's 37.17%.

Peers: The peers of Aditya Bir. Fas. are Arvind Ltd, Trident, Vedant Fashions, V2 Retail, Pearl Global Ind, Garware Tech, Indo Count Inds., Arvind Fashions, and Alok Industries.<BR><BR>Quality Snapshot: Excellent management risk is observed at Vedant Fashions, while Good management risk is found at Arvind Ltd, Pearl Global Ind, Garware Tech, and Indo Count Inds. Average management risk is present at Trident, V2 Retail, Arvind Fashions, and Aditya Bir. Fas., and Alok Industries does not qualify. Growth is Excellent at V2 Retail and Pearl Global Ind, while Good growth is seen at Arvind Ltd and the rest. Below Average growth is noted for Trident, Vedant Fashions, Garware Tech, Indo Count Inds., Aditya Bir. Fas., and Alok Industries, with Arvind Fashions showing Excellent growth. Capital Structure is Excellent at Vedant Fashions, Good at Arvind Ltd, Pearl Global Ind, Indo Count Inds., and Garware Tech, while Average is seen at Arvind Fashions and Aditya Bir. Fas., and Below Average at V2 Retail and Alok Industries.<BR><BR>Return Snapshot: The peer with the highest 1-year return is Arvind Ltd at 37.17%, while the lowest is Vedant Fashions at -50.85%. Aditya Bir. Fas. has a 1-year return of -23.72%, which is higher than Vedant Fashions but lower than Arvind Ltd. Additionally, the peers Garware Tech, Vedant Fashions, and Alok Industries have negative six-month returns.

View full answer

What does Aditya Bir. Fas. do?

10-Jun-2026

Aditya Birla Fashion & Retail Ltd is a Small Cap company in the Garments & Apparels industry, formed in 2015 from the Aditya Birla Group's apparel businesses. As of March 2026, it reported net sales of ₹1,990 Cr and a net loss of ₹148 Cr, with a market cap of ₹7,424 Cr.

Overview: <BR>Aditya Birla Fashion & Retail Ltd operates in the Garments & Apparels industry and is categorized as a Small Cap company.<BR><BR>History: <BR>The company was formed in May 2015 after the consolidation of the branded apparel businesses of the Aditya Birla Group, including the Madura Fashion division and subsidiaries Pantaloons Fashion & Retail Limited and Madura Garments Lifestyle Retail Company Limited. The latest quarterly results reported are for March 2026.<BR><BR>Financial Snapshot: <BR>Most recent Net Sales: 1,990 Cr (Quarterly Results - Mar 2026) <BR>Most recent Net Profit: -148 Cr (Quarterly Results - Mar 2026) <BR>Market-cap value: INR 7,424 Cr (Small Cap)<BR><BR>Key Metrics: <BR>P/E: N/A <BR>Industry P/E: 72 <BR>Dividend Yield: 0.00% <BR>Debt-Equity: 0.80 <BR>Return on Equity: -12.61% <BR>Price to Book: 1.26<BR><BR>Contact Details: <BR>Address: Piramal Agastya Corporate Park, Bldg-A 4&5 Flr LBS Marg Kurla Mumbai Maharashtra : 400070 <BR>Tel: 91-8652905000 <BR>Email: secretarial.abfrl@adityabirla.com <BR>Website: http://www.abfrl.com

View full answer

Should I buy, sell or hold Aditya Birla Fashion & Retail Ltd?

27-May-2026

Are Aditya Birla Fashion & Retail Ltd latest results good or bad?

26-May-2026

Aditya Birla Fashion & Retail Ltd's latest results show a year-on-year revenue growth of 15.74% to ₹1,990.13 crores, but the company reported a significant net loss of ₹148.40 crores, a 779.67% increase in losses compared to last year, indicating serious challenges in achieving profitability.

Aditya Birla Fashion & Retail Ltd's latest results indicate significant challenges for the company. While it achieved a year-on-year revenue growth of 15.74%, reaching ₹1,990.13 crores, this was overshadowed by a substantial net loss of ₹148.40 crores for the quarter, which represents a staggering 779.67% increase in losses compared to the same period last year.<BR><BR>The operating margin also declined to 9.92%, down 200 basis points from the previous year, reflecting deteriorating operational efficiency. The company's high interest and depreciation costs have continued to burden its financial performance, resulting in a structural profitability deficit. <BR><BR>Overall, while there are signs of top-line growth, the inability to translate this into profitability and the widening losses present a concerning picture for investors. The company is under pressure to demonstrate a credible path to sustained profitability in a highly competitive fashion retail landscape.

View full answer

When is the next results date for Aditya Birla Fashion & Retail Ltd?

21-May-2026

The next results date for Aditya Birla Fashion & Retail Ltd is 25 May 2026.

The next results date for Aditya Birla Fashion & Retail Ltd is scheduled for 25 May 2026.

View full answer

Is Aditya Bir. Fas. technically bullish or bearish?

05-Dec-2025

As of December 4, 2025, the technical indicators for Aditya Bir. Fas show a strong bearish trend, with negative signals from MACD, Bollinger Bands, and moving averages across both weekly and monthly time frames.

As of 4 December 2025, the technical trend has changed from mildly bearish to bearish. The current stance is bearish with a strong indication of weakness. The MACD is bearish on both the weekly and monthly time frames, and Bollinger Bands also reflect a bearish trend in both time frames. Daily moving averages confirm a bearish outlook. The KST shows a mildly bearish signal on the weekly but is bearish on the monthly. There is no trend indicated by Dow Theory or OBV in either time frame. Overall, the technical indicators strongly support a bearish sentiment for Aditya Bir. Fas.

View full answer

How has been the historical performance of Aditya Bir. Fas.?

04-Nov-2025

Aditya Bir. Fas. has experienced significant fluctuations in financial performance, with net sales increasing to 7,354.73 Cr in Mar'25 from 6,441.49 Cr in Mar'24, but down from 12,417.90 Cr in Mar'23. Despite improvements in operating profit and cash flow, the company reported losses in profit before and after tax, indicating a challenging environment with some signs of recovery.

Answer:<BR>The historical performance of Aditya Bir. Fas. shows significant fluctuations in key financial metrics over the years, particularly in net sales, operating profit, and net profit.<BR><BR>Breakdown:<BR>Aditya Bir. Fas. reported net sales of 7,354.73 Cr in Mar'25, an increase from 6,441.49 Cr in Mar'24, but a notable decline from 12,417.90 Cr in Mar'23. The total operating income followed a similar trend, reaching 7,354.73 Cr in Mar'25, compared to 6,441.49 Cr in Mar'24 and 12,417.90 Cr in Mar'23. The total expenditure, excluding depreciation, was 6,678.31 Cr in Mar'25, up from 6,071.47 Cr in Mar'24, while the operating profit (PBDIT) was 872.14 Cr in Mar'25, showing improvement from 507.73 Cr in Mar'24 but down from 1,610.04 Cr in Mar'23. However, the company faced losses, with a profit before tax of -700.50 Cr in Mar'25 and a profit after tax of -606.29 Cr, although these figures were improvements from -1,060.83 Cr and -919.77 Cr in Mar'24, respectively. The consolidated net profit was -375.82 Cr in Mar'25, an improvement from -628.02 Cr in Mar'24, but a stark contrast to the profit of 321.22 Cr in Mar'19. The company's total liabilities decreased to 16,393.97 Cr in Mar'25 from 21,790.39 Cr in Mar'24, while total assets also fell to 16,393.97 Cr from 21,790.39 Cr. Cash flow from operating activities improved to 1,643.00 Cr in Mar'25 from 1,341.00 Cr in Mar'24, contributing to a net cash inflow of 312.00 Cr in Mar'25, compared to a net outflow of -238.00 Cr in Mar'24. Overall, the financial performance of Aditya Bir. Fas. reflects a challenging environment with some signs of recovery in recent periods.

View full answer

Is Aditya Bir. Fas. overvalued or undervalued?

09-Jun-2025

As of August 7, 2023, Aditya Birla Fashion is considered overvalued with a valuation grade of risky, reflected by a PE ratio of -14.84, an EV to EBITDA of 9.90, and a Price to Book Value of 1.39, alongside a year-to-date return of -72.35% compared to the Sensex's gain of 5.66%.

As of 7 August 2023, the valuation grade for Aditya Birla Fashion has moved from expensive to risky. The company is currently assessed as overvalued. Key ratios include a PE ratio of -14.84, an EV to EBITDA of 9.90, and a Price to Book Value of 1.39. <BR><BR>In comparison with peers, Aditya Birla Fashion's PE ratio is significantly lower than Avenue Supermarts at 100.87 and Trent at 132.74, both categorized as very expensive. Additionally, the company's recent stock performance has been poor, with a year-to-date return of -72.35%, contrasting sharply with the Sensex's gain of 5.66% during the same period, further reinforcing the overvaluation narrative.

View full answer

Who are the top shareholders of the Aditya Bir. Fas.?

06-Jun-2025

The top shareholders of Aditya Bir. Fas. include Birla Group Holdings Private Limited with 19.39%, institutional investors with 32.48% (10.29% from mutual funds and 22.19% from FIIs), and Flipkart Investments Private Limited at 6%, while individual investors hold 10.97%.

The top shareholders of Aditya Bir. Fas. include several key players. The majority shareholders are the promoters, with Birla Group Holdings Private Limited holding the largest stake at 19.39%. Additionally, institutional investors are significant, with 50 mutual fund schemes collectively holding 10.29% and 167 foreign institutional investors (FIIs) holding 22.19%. The highest public shareholder is Flipkart Investments Private Limited, which owns 6%. Individual investors also have a notable presence, holding 10.97% of the shares.

View full answer

Has Aditya Bir. Fas. declared dividend?

06-Jun-2025

No Dividend History Available

iScoreScore
Click here to find our call on this stock
Strong Sell
Sell
Hold
Buy
Strong Buy

Dashboard

1

Weak Long Term Fundamental Strength with an average Return on Capital Employed (ROCE) of 0.93%

  • Poor long term growth as Net Sales has grown by an annual rate of 9.27% and Operating profit at 2.05% over the last 5 years
  • Low ability to service debt as the company has a high Debt to EBITDA ratio of 9.01 times
2

Flat results in Mar 26

3

Risky - Negative Operating Profits

4

Below par performance in long term as well as near term

stock-summaryMojo Parameters

Mojo Parameters

Loading Valuation Snapshot...

Stock DNA

stock-summary
Industry

Garments & Apparels

stock-summary
Market cap

INR 7,350 Cr (Small Cap)

stock-summary
P/E

NA (Loss Making)

stock-summary
Industry P/E

73

stock-summary
Dividend Yield

0.00%

stock-summary
Debt Equity

0.80

stock-summary
Return on Equity

-12.61%

stock-summary
Price to Book

1.27

Revenue and Profits:
Net Sales:
1,990 Cr
(Quarterly Results - Mar 2026)
Net Profit:
-148 Cr
stock-summaryTotal Returns
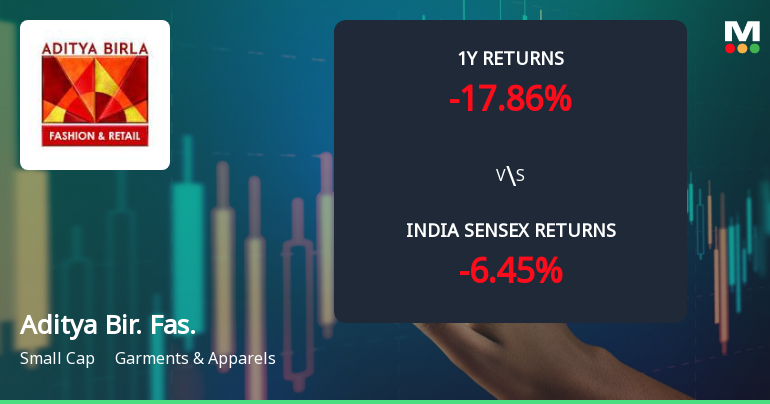
Total Returns (Price + Dividend) stock-summary
Dividend Yield (0%)
TimePeriod
Price Return
Dividend Return
Total Return
3 Months
5.76%
0%
5.76%
6 Months
-23.42%
0%
-23.42%
1 Year
-19.33%
0%
-19.33%
2 Years
-42.68%
0%
-42.68%
3 Years
-11.6%
0%
-11.6%
4 Years
-23.72%
0%
-23.72%
5 Years
-15.03%
0%
-15.03%

Aditya Bir. Fas. for the last several years.

Risk Adjusted Returns v/s stock-summary
Returns Beta
Icon
Beta has not been calculated since enough price history is not available
stock-summaryNews & Corporate Actions

Announcements stock-summary

Announcement under Regulation 30 (LODR)-Change in Directorate

15-Jun-2026 | Source : BSE

Re-designation and appointment of Ms. Sangeeta Tanwani as Non-Executive Non- Independent Director

Aditya Birla Digital Fashion Ventures Limited A Wholly Owned Subsidiary Of The Company Has Increased Its Stake In Its Subsidiary Bewakoof Brands Private Limited By 10.02% Through A Secondary Share Purchase.

08-Jun-2026 | Source : BSE

Aditya Birla Digital Fashion Ventures Limited a wholly owned subsidiary of the Company has increased its stake in its subsidiary Bewakoof Brands Private Limited by 10.02% through a secondary share purchase.

Disclosures under Reg. 29(2) of SEBI (SAST) Regulations 2011

02-Jun-2026 | Source : BSE

The Exchange has received the disclosure under Regulation 29(2) of SEBI (Substantial Acquisition of Shares & Takeovers) Regulations 2011 for Caladium Investment Pte Ltd

Corporate Actions stock-summary

stock-summary
BOARD MEETING

No Upcoming Board Meetings

stock-summary
DIVIDEND

No Dividend history available

stock-summary
SPLITS

No Splits history available

stock-summary
BONUS

No Bonus history available

stock-summary
RIGHTS

Aditya Birla Fashion & Retail Ltd has announced 9:77 rights issue, ex-date: 30 Jun 20

stock-summaryKey Factors

Quality key factors stock-summary

Factor
Value
Sales Growth (5y)
9.27%
EBIT Growth (5y)
2.05%
EBIT to Interest (avg)
-0.33
Debt to EBITDA (avg)
6.97
Net Debt to Equity (avg)
0.80
Sales to Capital Employed (avg)
0.93
Tax Ratio
10.58%
Dividend Payout Ratio
0
Pledged Shares
0
Institutional Holding
22.14%
ROCE (avg)
-1.36%
ROE (avg)
0

Valuation key factors

Factor
Value
P/E Ratio
NA (Loss Making)
Industry P/E
73
Price to Book Value
1.27
EV to EBIT
-18.46
EV to EBITDA
17.55
EV to Capital Employed
1.15
EV to Sales
1.47
PEG Ratio
NA
Dividend Yield
NA
ROCE (Latest)
-6.23%
ROE (Latest)
-12.61%

Technicals key factors

Indicator
Weekly
Monthly
MACD
Mildly Bullish
Bearish
RSI
No Signal
No Signal
Bollinger Bands
Bearish
Bearish
Moving Averages
Bearish (Daily)
KST
Mildly Bullish
Bearish
Dow Theory
No Trend
Mildly Bullish
OBV
No Trend
No Trend
stock-summary Technical Indicator Scale: Bearish, Mildly Bearish, Sideways, Mildly Bullish, Bullish  Turned 
stock-summaryShareholding
Shareholding Snapshot : Mar 2026stock-summary
Shareholding Compare (%holding) stock-summary
Majority shareholders

Promoters

Pledged Promoter Holdings

None

Mutual Funds

Held by 34 Schemes (5.61%)

FIIs

Held by 182 FIIs (15.52%)

Promoter with highest holding

Birla Group Holdings Private Limited (17.4%)

Highest Public shareholder

Caladium Investment Pte. Ltd. (4.94%)

Individual Investors Holdings

20.88%

stock-summaryFinancial
[
  {
    "link": "quarterly",
    "btn_text": "All Quarterly Results",
    "header": "Quarterly Results Snapshot (Consolidated) - Mar'26 - YoY",
    "rhs": [
      {
        "prefix": "Net Sales ",
        "suffix": "YoY Growth in quarter ended Mar 2026 is 15.74% vs 9.17% in Mar 2025",
        "dir": 1
      },
      {
        "prefix": "Consolidated Net Profit ",
        "suffix": "YoY Growth in quarter ended Mar 2026 is -779.67% vs 92.65% in Mar 2025",
        "dir": -1
      }
    ],
    "table": {
      "header": [
        "Mar'26",
        "Mar'25",
        "Change(%)"
      ],
      "body": [
        {
          "field": "Net Sales",
          "val1": "1,990.13",
          "val2": "1,719.48",
          "chgp": "15.74%",
          "chgp_class": "positive"
        },
        {
          "field": "Operating Profit (PBDIT) excl Other Income",
          "val1": "197.42",
          "val2": "204.89",
          "chgp": "-3.65%",
          "chgp_class": "negative"
        },
        {
          "field": "Interest",
          "val1": "145.66",
          "val2": "143.37",
          "chgp": "1.60%",
          "chgp_class": "negative"
        },
        {
          "field": "Exceptional Items",
          "val1": "-11.37",
          "val2": "147.09",
          "chgp": "-107.73%",
          "chgp_class": "negative"
        },
        {
          "field": "Consolidate Net Profit",
          "val1": "-148.40",
          "val2": "-16.87",
          "chgp": "-779.67%",
          "chgp_class": "negative"
        },
        {
          "field": "Operating Profit Margin (Excl OI)",
          "val1": "9.92%",
          "val2": "11.92%",
          "chgp": "-2.00%",
          "chgp_class": "negative"
        }
      ]
    }
  },
  {
    "link": "half-yearly",
    "btn_text": "All Half Yearly Results",
    "header": "Half Yearly Results Snapshot (Consolidated) - Sep'25",
    "rhs": [
      {
        "prefix": "Net Sales ",
        "suffix": " Growth in half year ended Sep 2025 is 11.02% vs -46.52% in Sep 2024",
        "dir": 1
      },
      {
        "prefix": "Consolidated Net Profit ",
        "suffix": " Growth in half year ended Sep 2025 is -54.50% vs 4.04% in Sep 2024",
        "dir": -1
      }
    ],
    "table": {
      "header": [
        "Sep'25",
        "Sep'24",
        "Change(%)"
      ],
      "body": [
        {
          "field": "Net Sales",
          "val1": "3,813.12",
          "val2": "3,434.73",
          "chgp": "11.02%",
          "chgp_class": "positive"
        },
        {
          "field": "Operating Profit (PBDIT) excl Other Income",
          "val1": "180.48",
          "val2": "169.87",
          "chgp": "6.25%",
          "chgp_class": "positive"
        },
        {
          "field": "Interest",
          "val1": "237.57",
          "val2": "273.33",
          "chgp": "-13.08%",
          "chgp_class": "positive"
        },
        {
          "field": "Exceptional Items",
          "val1": "0.00",
          "val2": "122.09",
          "chgp": "-100.00%",
          "chgp_class": "negative"
        },
        {
          "field": "Consolidate Net Profit",
          "val1": "-475.31",
          "val2": "-307.64",
          "chgp": "-54.50%",
          "chgp_class": "negative"
        },
        {
          "field": "Operating Profit Margin (Excl OI)",
          "val1": "4.73%",
          "val2": "4.95%",
          "chgp": "-0.22%",
          "chgp_class": "negative"
        }
      ]
    }
  },
  {
    "link": "nine-monthly",
    "btn_text": "All Nine Monthly Results",
    "header": "Nine Monthly Results Snapshot (Consolidated) - Dec'25",
    "rhs": [
      {
        "prefix": "Net Sales ",
        "suffix": "YoY Growth in nine months ended Dec 2025 is 9.79% vs -46.78% in Dec 2024",
        "dir": 1
      },
      {
        "prefix": "Consolidated Net Profit ",
        "suffix": "YoY Growth in nine months ended Dec 2025 is -74.83% vs 9.91% in Dec 2024",
        "dir": -1
      }
    ],
    "table": {
      "header": [
        "Dec'25",
        "Dec'24",
        "Change(%)"
      ],
      "body": [
        {
          "field": "Net Sales",
          "val1": "6,186.78",
          "val2": "5,635.25",
          "chgp": "9.79%",
          "chgp_class": "positive"
        },
        {
          "field": "Operating Profit (PBDIT) excl Other Income",
          "val1": "489.20",
          "val2": "471.53",
          "chgp": "3.75%",
          "chgp_class": "positive"
        },
        {
          "field": "Interest",
          "val1": "370.03",
          "val2": "424.02",
          "chgp": "-12.73%",
          "chgp_class": "positive"
        },
        {
          "field": "Exceptional Items",
          "val1": "-28.48",
          "val2": "182.41",
          "chgp": "-115.61%",
          "chgp_class": "negative"
        },
        {
          "field": "Consolidate Net Profit",
          "val1": "-627.54",
          "val2": "-358.95",
          "chgp": "-74.83%",
          "chgp_class": "negative"
        },
        {
          "field": "Operating Profit Margin (Excl OI)",
          "val1": "7.91%",
          "val2": "8.37%",
          "chgp": "-0.46%",
          "chgp_class": "negative"
        }
      ]
    }
  },
  {
    "link": "annual",
    "btn_text": "All Annual Results",
    "header": "Annual Results Snapshot (Consolidated) - Mar'26",
    "rhs": [
      {
        "prefix": "Net Sales ",
        "suffix": "YoY Growth in year ended Mar 2026 is 11.18% vs 14.18% in Mar 2025",
        "dir": -1
      },
      {
        "prefix": "Consolidated Net Profit ",
        "suffix": "YoY Growth in year ended Mar 2026 is -106.45% vs 40.16% in Mar 2025",
        "dir": -1
      }
    ],
    "table": {
      "header": [
        "Mar'26",
        "Mar'25",
        "Change(%)"
      ],
      "body": [
        {
          "field": "Net Sales",
          "val1": "8,176.92",
          "val2": "7,354.73",
          "chgp": "11.18%",
          "chgp_class": "positive"
        },
        {
          "field": "Operating Profit (PBDIT) excl Other Income",
          "val1": "686.64",
          "val2": "676.42",
          "chgp": "1.51%",
          "chgp_class": "positive"
        },
        {
          "field": "Interest",
          "val1": "515.68",
          "val2": "567.39",
          "chgp": "-9.11%",
          "chgp_class": "positive"
        },
        {
          "field": "Exceptional Items",
          "val1": "-39.86",
          "val2": "329.50",
          "chgp": "-112.10%",
          "chgp_class": "negative"
        },
        {
          "field": "Consolidate Net Profit",
          "val1": "-775.89",
          "val2": "-375.82",
          "chgp": "-106.45%",
          "chgp_class": "negative"
        },
        {
          "field": "Operating Profit Margin (Excl OI)",
          "val1": "8.40%",
          "val2": "9.20%",
          "chgp": "-0.80%",
          "chgp_class": "negative"
        }
      ]
    }
  }
]

Quarterly Results Snapshot (Consolidated) - Mar'26 - YoYstock-summary

Mar'26
Mar'25
Change(%)
Net Sales
1,990.13
1,719.48
15.74%
Operating Profit (PBDIT) excl Other Income
197.42
204.89
-3.65%
Interest
145.66
143.37
1.60%
Exceptional Items
-11.37
147.09
-107.73%
Consolidate Net Profit
-148.40
-16.87
-779.67%
Operating Profit Margin (Excl OI)
9.92%
11.92%
-2.00%
Values in Rs Cr.
Direction Arrows
Net Sales

YoY Growth in quarter ended Mar 2026 is 15.74% vs 9.17% in Mar 2025

Direction Arrows
Consolidated Net Profit

YoY Growth in quarter ended Mar 2026 is -779.67% vs 92.65% in Mar 2025

Half Yearly Results Snapshot (Consolidated) - Sep'25stock-summary

Sep'25
Sep'24
Change(%)
Net Sales
3,813.12
3,434.73
11.02%
Operating Profit (PBDIT) excl Other Income
180.48
169.87
6.25%
Interest
237.57
273.33
-13.08%
Exceptional Items
0.00
122.09
-100.00%
Consolidate Net Profit
-475.31
-307.64
-54.50%
Operating Profit Margin (Excl OI)
4.73%
4.95%
-0.22%
Values in Rs Cr.
Direction Arrows
Net Sales

Growth in half year ended Sep 2025 is 11.02% vs -46.52% in Sep 2024

Direction Arrows
Consolidated Net Profit

Growth in half year ended Sep 2025 is -54.50% vs 4.04% in Sep 2024

Nine Monthly Results Snapshot (Consolidated) - Dec'25stock-summary

Dec'25
Dec'24
Change(%)
Net Sales
6,186.78
5,635.25
9.79%
Operating Profit (PBDIT) excl Other Income
489.20
471.53
3.75%
Interest
370.03
424.02
-12.73%
Exceptional Items
-28.48
182.41
-115.61%
Consolidate Net Profit
-627.54
-358.95
-74.83%
Operating Profit Margin (Excl OI)
7.91%
8.37%
-0.46%
Values in Rs Cr.
Direction Arrows
Net Sales

YoY Growth in nine months ended Dec 2025 is 9.79% vs -46.78% in Dec 2024

Direction Arrows
Consolidated Net Profit

YoY Growth in nine months ended Dec 2025 is -74.83% vs 9.91% in Dec 2024

Annual Results Snapshot (Consolidated) - Mar'26stock-summary

Mar'26
Mar'25
Change(%)
Net Sales
8,176.92
7,354.73
11.18%
Operating Profit (PBDIT) excl Other Income
686.64
676.42
1.51%
Interest
515.68
567.39
-9.11%
Exceptional Items
-39.86
329.50
-112.10%
Consolidate Net Profit
-775.89
-375.82
-106.45%
Operating Profit Margin (Excl OI)
8.40%
9.20%
-0.80%
Values in Rs Cr.
Direction Arrows
Net Sales

YoY Growth in year ended Mar 2026 is 11.18% vs 14.18% in Mar 2025

Direction Arrows
Consolidated Net Profit

YoY Growth in year ended Mar 2026 is -106.45% vs 40.16% in Mar 2025

stock-summaryCompany CV
About Aditya Birla Fashion & Retail Ltd stock-summary
stock-summary
Aditya Birla Fashion & Retail Ltd
Small Cap
Garments & Apparels
Aditya Birla Fashion and Retail Limited (ABFRL), formerly known as Pantaloons Fashion & Retail Limited, was formed after the consolidation of the branded apparel businesses of Aditya Birla Group comprising Aditya Birla Nuvo Ltd.'s (ABNL) Madura Fashion division and ABNL's subsidiaries Pantaloons Fashion & Retail Limited (PFRL) and Madura Garments Lifestyle Retail Company Limited (MGLRCL) in May 2015.
Company Coordinates stock-summary
Company Details
Piramal Agastya Corporate Park, Bldg-A 4&5 Flr LBS Marg Kurla Mumbai Maharashtra : 400070
stock-summary
Tel: 91-8652905000
stock-summary
secretarial.abfrl@adityabirla.com
Registrar Details
Link Intime India Pvt Ltd, C-13 Pannalal Silk Compound, L B S Marg, Bhandup , Mumbai