
Compare Artefact Project with Similar Stocks
Dashboard
Weak Long Term Fundamental Strength as the company has not declared results in the last 6 months
- Poor long term growth as Net Sales has grown by an annual rate of 0.10% and Operating profit at 3.37% over the last 5 years
Negative results in Mar 26
Below par performance in long term as well as near term
Stock DNA
Commercial Services & Supplies
INR 39 Cr (Micro Cap)
7.00
35
0.85%
0.18
7.58%
0.56
Total Returns (Price + Dividend) 
Latest dividend: 0.5 per share ex-dividend date: Sep-12-2025
Risk Adjusted Returns v/s
Returns Beta

News
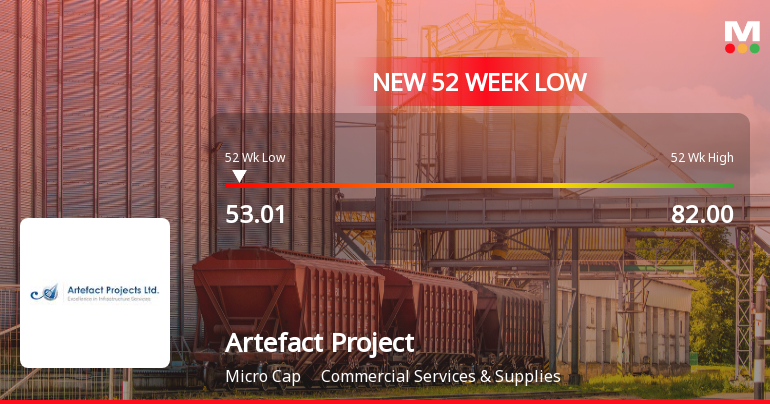
Markets Rally, But Artefact Projects Ltd Sinks to 52-Week Low in Stock-Specific Sell-Off
Despite a broadly resilient market, Artefact Projects Ltd has succumbed to selling pressure, hitting a fresh 52-week low of Rs 53.01 on 20 Jul 2026. This decline comes amid a backdrop of underwhelming financial performance and technical weakness, raising questions about the stock’s near-term outlook.
Read full news article
Artefact Projects Ltd is Rated Strong Sell
Artefact Projects Ltd is rated Strong Sell by MarketsMOJO, with this rating last updated on 29 May 2026. However, the analysis and financial metrics presented here reflect the stock’s current position as of 16 July 2026, providing investors with an up-to-date view of the company’s fundamentals, valuation, financial trends, and technical outlook.
Read full news article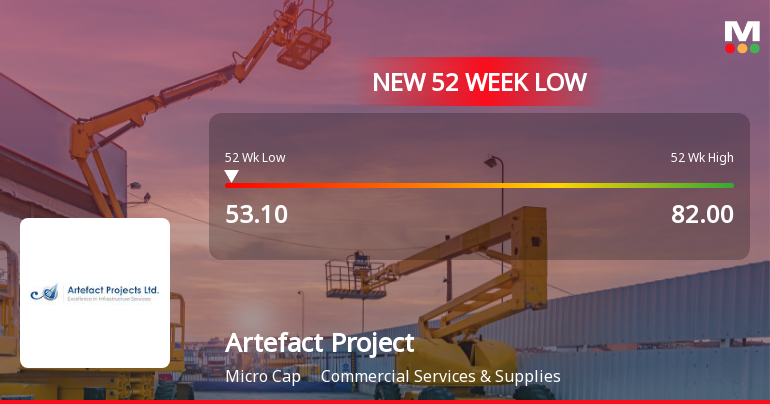
Announcements
Announcement under Regulation 30 (LODR)-Award_of_Order_Receipt_of_Order
16-Jul-2026 | Source : BSEletter of Award
Compliances-Certificate under Reg. 74 (5) of SEBI (DP) Regulations 2018
07-Jul-2026 | Source : BSERegulation 74(5)
Announcement under Regulation 30 (LODR)-Award_of_Order_Receipt_of_Order
07-Jul-2026 | Source : BSEletter of Award
Corporate Actions

No Upcoming Board Meetings

Artefact Projects Ltd has declared 5% dividend, ex-date: 12 Sep 25

No Splits history available

No Bonus history available

No Rights history available
Quality key factors
Valuation key factors
Technicals key factors
 Technical Indicator Scale: Bearish, Mildly Bearish, Sideways, Mildly Bullish, Bullish Turned
 Shareholding Snapshot : Mar 2026
Shareholding Compare (%holding)
Non Institution
None
Held by 0 Schemes
Held by 0 FIIs
Pankaj Balkrishna Shah (13.37%)
Mahendra Girdharilal (4%)
50.06%
Quarterly Results Snapshot (Standalone) - Dec'25 - QoQ

QoQ Growth in quarter ended Dec 2025 is -24.86% vs 305.88% in Sep 2025
QoQ Growth in quarter ended Dec 2025 is 0.60% vs 63.73% in Sep 2025
Half Yearly Results Snapshot (Standalone) - Sep'25

Growth in half year ended Sep 2025 is 12.14% vs -6.56% in Sep 2024
Growth in half year ended Sep 2025 is -16.20% vs 0.63% in Sep 2024
Nine Monthly Results Snapshot (Standalone) - Dec'25
YoY Growth in nine months ended Dec 2025 is 3.58% vs 1.47% in Dec 2024
YoY Growth in nine months ended Dec 2025 is -1.80% vs -11.18% in Dec 2024
Annual Results Snapshot (Standalone) - Mar'26
YoY Growth in year ended Mar 2026 is 7.32% vs 24.33% in Mar 2025
YoY Growth in year ended Mar 2026 is -29.61% vs 42.07% in Mar 2025
About Artefact Projects Ltd

Company Coordinates


