
Compare Radico Khaitan with Similar Stocks
Dashboard
High Management Efficiency with a high ROCE of 15.45%
Strong ability to service debt as the company has a low Debt to EBITDA ratio of 0.49 times
Healthy long term growth as Net Sales has grown by an annual rate of 20.19%
With a growth in Net Profit of 12.93%, the company declared Very Positive results in Mar 26
High Institutional Holdings at 44.98%
Consistent Returns over the last 3 years
Stock DNA
Beverages
INR 49,982 Cr (Mid Cap)
82.00
56
0.11%
0.12
18.60%
15.17
Total Returns (Price + Dividend) 
Latest dividend: 4 per share ex-dividend date: Jul-24-2025
Risk Adjusted Returns v/s
Returns Beta

News
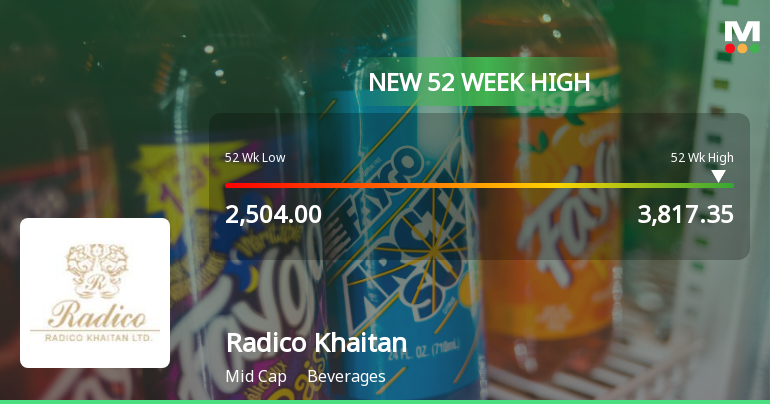
Broad-Based Technical Strength Lifts Radico Khaitan Ltd. to 52-Week High of Rs 3817.35
With a sustained rally that has propelled Radico Khaitan Ltd. to a new 52-week and all-time high of Rs 3817.35 on 23 Jun 2026, the stock’s momentum is underpinned by a confluence of bullish technical indicators and robust price action that outpaces the broader market.
Read full news article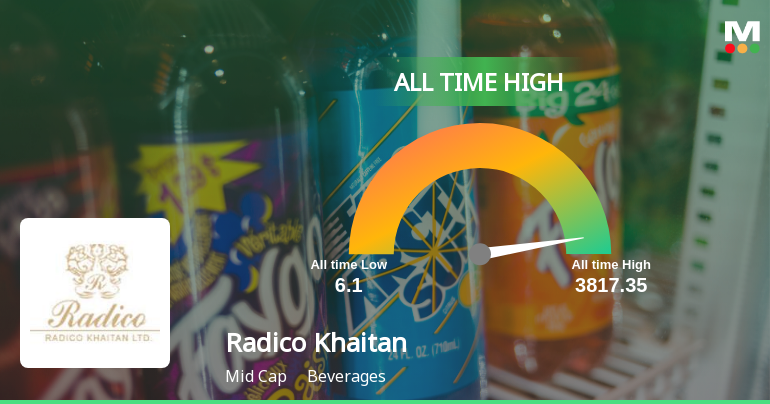
Radico Khaitan Ltd. Hits All-Time High of Rs 3,817.35 as Momentum Builds Across Timeframes
Extending its winning streak to four consecutive sessions, Radico Khaitan Ltd. touched a fresh all-time high of Rs 3,817.35 on 23 Jun 2026, outpacing the broader Sensex which remained flat. The stock’s 6.41% gain over this period highlights robust momentum that has been building steadily across multiple timeframes.
Read full news article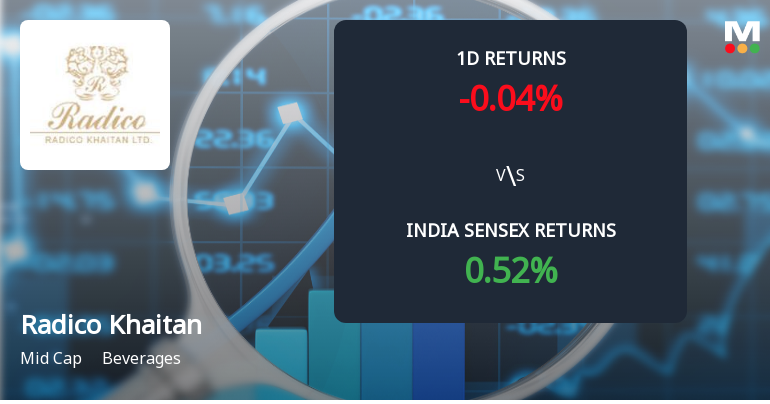
Radico Khaitan Sees Significant Open Interest Surge Amidst Mixed Price Action
Radico Khaitan Ltd., a prominent player in the beverages sector, has witnessed a notable surge in open interest (OI) in its derivatives segment, signalling heightened market activity and shifting investor positioning. This development comes amid a backdrop of recent price volatility and evolving volume patterns, suggesting potential directional bets by market participants.
Read full news article Announcements
Announcement under Regulation 30 (LODR)-Newspaper Publication
19-Jun-2026 | Source : BSENewspaper Advertisement - Special Window for transfer and dematerialization (demat) of physical shares.
Announcement under Regulation 30 (LODR)-Analyst / Investor Meet - Intimation
18-Jun-2026 | Source : BSEIntimation regarding Investor Meeting(s).
Announcement under Regulation 30 (LODR)-Newspaper Publication
17-Jun-2026 | Source : BSESubmission of Copy of Newspaper Advertisement published in Hindustan Moradabad Edition (Hindi) regarding loss of share certificate(s).
Corporate Actions

No Upcoming Board Meetings

Radico Khaitan Ltd. has declared 450% dividend, ex-date: 24 Jul 26

No Splits history available

No Bonus history available

No Rights history available
Quality key factors
Valuation key factors
Technicals key factors
 Technical Indicator Scale: Bearish, Mildly Bearish, Sideways, Mildly Bullish, Bullish Turned
 Shareholding Snapshot : Mar 2026
Shareholding Compare (%holding)
Promoters
None
Held by 38 Schemes (21.33%)
Held by 262 FIIs (17.63%)
Sapphire Intrex Limited (33.89%)
Nippon Life India Trustee Ltd.-a/c Nippon India Ac (3.9%)
10.84%
Quarterly Results Snapshot (Consolidated) - Mar'26 - QoQ

QoQ Growth in quarter ended Mar 2026 is -2.78% vs 3.54% in Dec 2025

QoQ Growth in quarter ended Mar 2026 is 15.83% vs 11.01% in Dec 2025
Half Yearly Results Snapshot (Consolidated) - Sep'25
Growth in half year ended Sep 2025 is 33.16% vs 19.90% in Sep 2024
Growth in half year ended Sep 2025 is 70.88% vs 18.74% in Sep 2024
Nine Monthly Results Snapshot (Consolidated) - Dec'25
YoY Growth in nine months ended Dec 2025 is 28.18% vs 16.69% in Dec 2024
YoY Growth in nine months ended Dec 2025 is 67.63% vs 21.74% in Dec 2024
Annual Results Snapshot (Consolidated) - Mar'26
YoY Growth in year ended Mar 2026 is 24.72% vs 17.79% in Mar 2025
YoY Growth in year ended Mar 2026 is 74.90% vs 31.83% in Mar 2025
About Radico Khaitan Ltd.

Company Coordinates


