
Compare Gokaldas Exports with Similar Stocks
Dashboard
Strong ability to service debt as the company has a low Debt to EBITDA ratio of 3.58 times
Healthy long term growth as Net Sales has grown by an annual rate of 26.95% and Operating profit at 31.51%
The company has declared Negative results for the last 3 consecutive quarters
With ROCE of 6.3, it has a Expensive valuation with a 2.3 Enterprise value to Capital Employed
96.28% of Promoter Shares are Pledged
Stock DNA
Garments & Apparels
INR 6,027 Cr (Small Cap)
60.00
25
0.00%
0.39
4.63%
2.76
Total Returns (Price + Dividend) 
Latest dividend: 1 per share ex-dividend date: Sep-13-2023
Risk Adjusted Returns v/s
Returns Beta

News

Gokaldas Exports Ltd Upgraded to Hold as Technicals Improve Despite Valuation Concerns
Gokaldas Exports Ltd, a small-cap player in the Garments & Apparels sector, has seen its investment rating upgraded from Sell to Hold as of 19 June 2026. This change reflects a nuanced reassessment across four key parameters: quality, valuation, financial trend, and technicals. While valuation metrics have become more expensive, technical indicators have improved, prompting a more balanced outlook despite recent financial challenges.
Read full news article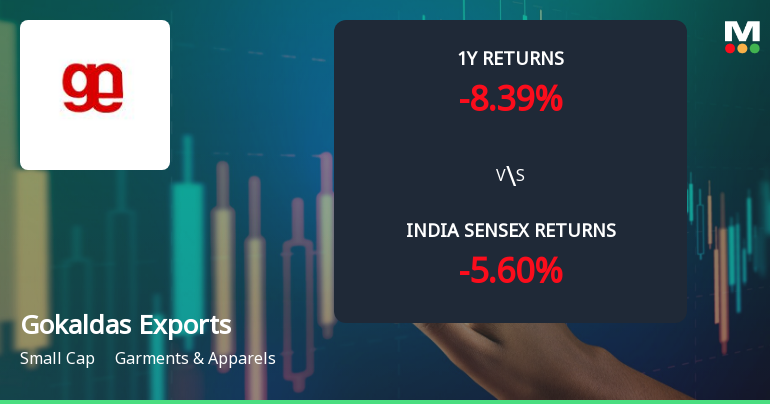
Gokaldas Exports Ltd Technical Momentum Shifts Signal Mild Bullish Outlook
Gokaldas Exports Ltd, a small-cap player in the Garments & Apparels sector, has exhibited a notable shift in its technical momentum, moving from a mildly bearish to a mildly bullish trend. This change is underscored by a complex interplay of technical indicators including MACD, RSI, Bollinger Bands, and moving averages, signalling a cautious yet optimistic outlook for investors.
Read full news article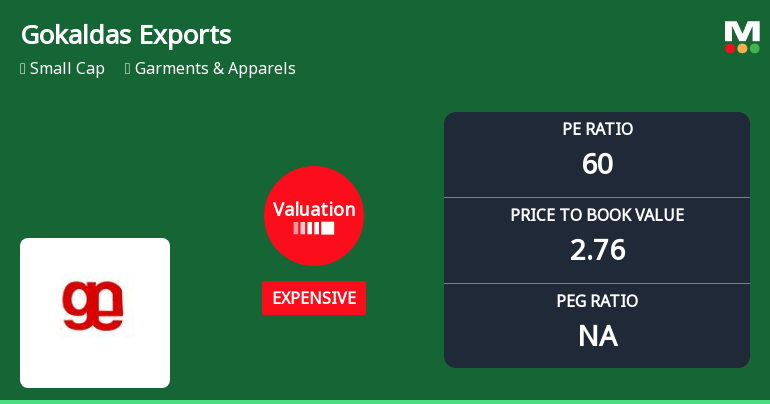
Gokaldas Exports Ltd Valuation Shifts Signal Changing Market Sentiment
Gokaldas Exports Ltd has witnessed a notable shift in its valuation parameters, moving from a fair to an expensive rating, driven primarily by a surge in its price-to-earnings (P/E) ratio and price-to-book value (P/BV). This article examines the implications of these changes in the context of the garment and apparel sector, peer comparisons, and the company’s recent market performance.
Read full news article Announcements
Announcement under Regulation 30 (LODR)-Analyst / Investor Meet - Intimation
02-Jun-2026 | Source : BSESchedule of Institutional Investors meeting to be held with Senior Management of the Company from June 08 2026 to June 10 2026.
Disclosures under Reg. 29(2) of SEBI (SAST) Regulations 2011
02-Jun-2026 | Source : BSEThe Exchange has received the disclosure under Regulation 29(2) of SEBI (Substantial Acquisition of Shares & Takeovers) Regulations 2011 for Goldman Sachs Asset Management International & PAC
Announcement under Regulation 30 (LODR)-Earnings Call Transcript
02-Jun-2026 | Source : BSETranscript of Q4 FY26 earnings conference call held on May 25 2026.
Corporate Actions

No Upcoming Board Meetings

Gokaldas Exports Ltd has declared 20% dividend, ex-date: 13 Sep 23

Gokaldas Exports Ltd has announced 5:10 stock split, ex-date: 08 Feb 07

No Bonus history available

No Rights history available
Quality key factors
Valuation key factors
Technicals key factors
 Technical Indicator Scale: Bearish, Mildly Bearish, Sideways, Mildly Bullish, Bullish Turned
 Shareholding Snapshot : Mar 2026
Shareholding Compare (%holding)
Non Institution
96.2807
Held by 19 Schemes (32.53%)
Held by 84 FIIs (19.84%)
Clear Wealth Consultancy Services Llp (8.81%)
Nippon Life India Trustee Ltd-a/c Nippon India Sma (7.42%)
23.19%
Quarterly Results Snapshot (Consolidated) - Mar'26 - YoY

YoY Growth in quarter ended Mar 2026 is 5.27% vs 24.98% in Mar 2025
YoY Growth in quarter ended Mar 2026 is -31.97% vs 19.38% in Mar 2025
Half Yearly Results Snapshot (Consolidated) - Sep'25
Growth in half year ended Sep 2025 is 4.24% vs 83.38% in Sep 2024
Growth in half year ended Sep 2025 is -10.44% vs -1.65% in Sep 2024
Nine Monthly Results Snapshot (Consolidated) - Dec'25
YoY Growth in nine months ended Dec 2025 is 2.45% vs 81.87% in Dec 2024
YoY Growth in nine months ended Dec 2025 is -39.28% vs 21.91% in Dec 2024
Annual Results Snapshot (Consolidated) - Mar'26
YoY Growth in year ended Mar 2026 is 3.19% vs 62.44% in Mar 2025
YoY Growth in year ended Mar 2026 is -36.84% vs 21.05% in Mar 2025
About Gokaldas Exports Ltd

Company Coordinates


