Gokaldas Exports

  • Market Cap: Small Cap
  • Industry: Garments & Apparels
  • ISIN: INE887G01027
  • NSEID: GOKEX
  • BSEID: 532630
INR
728.05
1.4 (0.19%)
BSENSE

Sep 18, 04:01 PM

BSE+NSE Vol: 2.81 lacs

  • Price Points
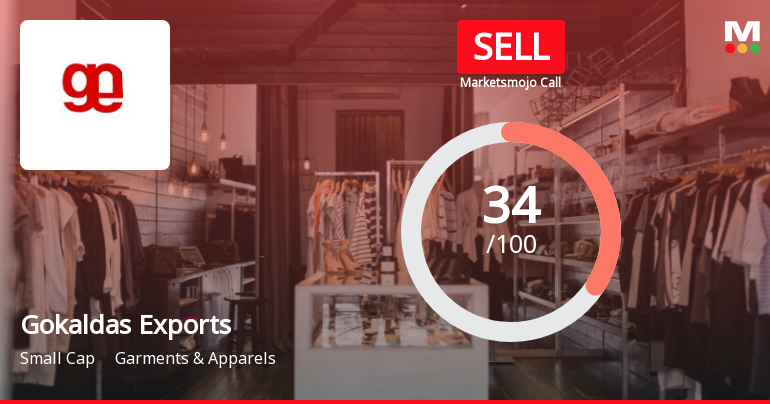
  • Score
  • Mojo Parameters
  • Total Return
  • News and Corporate Actions
  • Key factors
  • Shareholding
  • Financials
  • CompanyCV
stock-summaryPrice Point
High/Low

1Day

52 Week

Valuation
Technical
Day's Volume

CASH

2.81 lacs (-5.40%) Volume

Shareholding (Jun 2026)

FII

14.46%

Held by 89 FIIs

DII

43.41%

Held by 46 DIIs

Promoter

9.15%

Why is Gokaldas Exports Ltd falling/rising?

06-Sep-2026

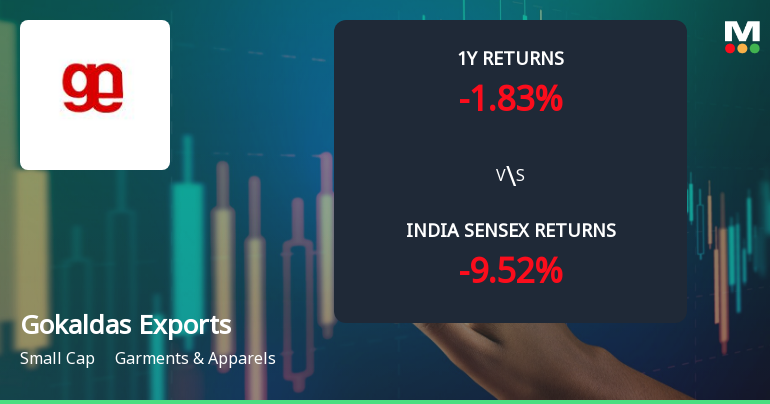
As of 05-Sep, Gokaldas Exports Ltd's stock price is rising to Rs 789.70, up 2.92%, driven by a trend reversal and outperforming its sector. However, concerns remain due to negative quarterly results and a high percentage of pledged promoter shares.

As of 05-Sep, Gokaldas Exports Ltd's stock price is rising, currently at Rs 789.70, reflecting an increase of Rs 22.4 or 2.92%. This upward movement can be attributed to several factors. Notably, the stock has outperformed its sector by 2.89% today and has shown a trend reversal, gaining after two consecutive days of decline. Additionally, the stock reached an intraday high of Rs 801.1, which is a 4.41% increase.<BR><BR>In terms of performance relative to benchmarks, Gokaldas Exports has demonstrated resilience, with a year-to-date return of +6.73%, while the Sensex has declined by -10.21%. Over the past week, the stock has increased by +2.95%, contrasting with the Sensex's -0.97% decline. This suggests that the stock is gaining traction despite broader market challenges.<BR><BR>However, it is important to note that there are underlying concerns. The company has reported negative results for the last four consecutive quarters, with a significant decline in profit after tax (PAT) of -34.42% over the past nine months. Additionally, a high percentage of promoter shares (96.28%) are pledged, which can exert downward pressure on the stock in a falling market. Despite these challenges, the stock's current rise appears to be driven by short-term trading dynamics and its recent performance relative to the sector and market benchmarks.

View full answer

Should I buy, sell or hold Gokaldas Exports Ltd?

03-Sep-2026

Who are in the management team of Gokaldas Exports?

01-Sep-2026

The management team of Gokaldas Exports includes Mathew Cyriac (Chairman), Sivaramakrishnan Vilayur Ganapathi (Vice Chairman), Prabhat Kumar Singh (Executive Director), George Varughese, Bijapurkar Rama, and Shivanandan Ashok Dalvie (Independent Directors), along with Sundararajan Poorana Seenivasan (Executive Director). They are responsible for the company's strategic direction and operations.

The management team of Gokaldas Exports includes the following key individuals:<BR><BR>1. **Mathew Cyriac** - Chairman (Non-Executive) and Director (Non-Independent)<BR>2. **Sivaramakrishnan Vilayur Ganapathi** - Vice Chairman and Executive Director<BR>3. **Prabhat Kumar Singh** - Executive Director and Whole-time Director<BR>4. **George Varughese** - Independent Non-Executive Director<BR>5. **Bijapurkar Rama** - Independent Non-Executive Director<BR>6. **Shivanandan Ashok Dalvie** - Independent Non-Executive Director<BR>7. **Sundararajan Poorana Seenivasan** - Executive Director<BR><BR>This team plays a crucial role in guiding the company's strategic direction and operations.

View full answer

What does Gokaldas Exports do?

01-Sep-2026

Gokaldas Exports Ltd is a small-cap company in the readymade garment industry, with net sales of ₹1,154 Cr and a net profit of ₹44 Cr as of June 2026. It was incorporated in 2004 and has a market cap of ₹5,659 Cr.

Overview: <BR>Gokaldas Exports Ltd is a major player in the readymade garment industry, operating within the small-cap market segment.<BR><BR>History: <BR>Gokaldas Exports Limited was incorporated on March 1, 2004, by converting the erstwhile partnership firm Gokaldas India. The latest quarterly results reported net sales and profit for June 2026.<BR><BR>Financial Snapshot: <BR>Net Sales: 1,154 Cr (Quarterly Results - Jun 2026) <BR>Net Profit: 44 Cr (Quarterly Results - Jun 2026) <BR>Market Cap: INR 5,659 Cr (Small Cap)<BR><BR>Key Metrics: <BR>P/E: 56.00 <BR>Industry P/E: 28 <BR>Dividend Yield: 0.00% <BR>Debt-Equity: 0.39 <BR>Return on Equity: 4.63% <BR>Price to Book: 2.61 <BR><BR>Contact Details: <BR>Address: 16/2 Prestige Dot Com, Residency Road Bangalore Karnataka : 560025 <BR>Tel: 91-080-22223600/01/02/41272200 <BR>Email: investorcare@gokaldasexports.com <BR>Website: http://www.gokaldasindia.com

View full answer

Who are the peers of the Gokaldas Exports?

01-Sep-2026

Gokaldas Exports' peers include V2 Retail, Garware Tech, Aditya Birla Fashion, Arvind Fashions, PDS, Alok Industries, Raymond Lifestyle, Jindal Worldwide, and Sanathan Textile. Gokaldas Exports shows excellent growth and a good capital structure, with a 1-year return of 15.94%, while V2 Retail leads with a 28.90% return.

Peers: The peers of Gokaldas Exports are V2 Retail, Garware Tech, Aditya Bir. Fas., Arvind Fashions, PDS, Alok Industries, Raymond Lifestyl, Jindal Worldwide, and Sanathan Textile.<BR><BR>Quality Snapshot: Excellent management risk is observed at Garware Tech and PDS, while Average management risk is found at V2 Retail, Aditya Bir. Fas., Arvind Fashions, Gokaldas Exports, Raymond Lifestyl, Jindal Worldwide, and the rest. Below Average management risk is noted at Sanathan Textile. For growth, Excellent growth is seen at Gokaldas Exports and Arvind Fashions, while Average growth is found at PDS, and Below Average growth is observed at V2 Retail, Garware Tech, Aditya Bir. Fas., Raymond Lifestyl, Jindal Worldwide, and the rest. Gokaldas Exports has a Good capital structure, while Excellent capital structure is noted at Garware Tech, and Below Average capital structure is found at V2 Retail, Aditya Bir. Fas., Arvind Fashions, and the rest.<BR><BR>Return Snapshot: The peer with the highest 1-year return is V2 Retail at 28.90%, while Alok Industries has the lowest at -51.23%. Gokaldas Exports has a 1-year return of 15.94%, which is significantly higher than Alok Industries but lower than V2 Retail. Additionally, Alok Industries and Raymond Lifestyl have negative six-month returns.

View full answer

How big is Gokaldas Exports?

01-Sep-2026

As of 31st August, Gokaldas Exports Ltd has a market capitalization of 5,659.00 Cr, with recent net sales of 4,185.36 Cr and a net profit of 102.95 Cr. The company reported shareholder's funds of 2,080.68 Cr and total assets of 3,499.99 Cr for the latest annual period ending in March 2025.

As of 31st August, Gokaldas Exports Ltd has a market capitalization of 5,659.00 Cr, categorizing it as a Small Cap company.<BR><BR>In the latest 4 quarters, Gokaldas Exports reported Net Sales of 4,185.36 Cr and a Net Profit of 102.95 Cr.<BR><BR>For the latest annual period ending in March 2025, the company reported Shareholder's Funds of 2,080.68 Cr and Total Assets of 3,499.99 Cr.

View full answer

When is the next results date for Gokaldas Exports Ltd?

06-Aug-2026

The next results date for Gokaldas Exports Ltd is 11 August 2026.

The next results date for Gokaldas Exports Ltd is scheduled for 11 August 2026.

View full answer

Are Gokaldas Exports Ltd latest results good or bad?

23-May-2026

Gokaldas Exports Ltd's latest results show a significant quarterly profit increase of 146.13% and record revenue, but a concerning 31.97% year-on-year profit decline and reduced operating margins indicate ongoing profitability challenges, leading to a cautious outlook. Additionally, the stock has underperformed, dropping 27.65% over the past year.

Gokaldas Exports Ltd's latest results present a mixed picture. On one hand, the company reported a significant sequential improvement in net profit, which surged by 146.13% quarter-on-quarter to ₹35.96 crores in Q4 FY26. Additionally, revenue increased by 9.22% quarter-on-quarter and 5.27% year-on-year, reaching ₹1,068.85 crores, marking the highest quarterly revenue in the company's recent history.<BR><BR>However, the year-on-year performance raises concerns. The net profit declined by 31.97% compared to the same quarter last year, reflecting ongoing challenges in maintaining profitability despite revenue growth. The operating margin also fell to 10.90%, down from 12.07% a year ago, indicating pressure on margins.<BR><BR>Moreover, the company has faced significant underperformance in its stock price, declining 27.65% over the past year, which is considerably worse than the broader market's decline. This underperformance is attributed to investor concerns over profitability erosion and high valuations, with the stock trading at a P/E ratio of 43.56, well above the industry average.<BR><BR>In summary, while there are signs of operational recovery in the latest quarter, the overall results indicate serious challenges in profitability and margin sustainability, making the outlook cautious.

View full answer

Is Gokaldas Exports technically bullish or bearish?

02-Dec-2025

As of December 1, 2025, the market trend is mildly bearish due to bearish daily moving averages and mixed signals from weekly and monthly indicators, with bearish factors outweighing bullish ones.

As of 1 December 2025, the technical trend has changed from mildly bullish to mildly bearish. The current stance is mildly bearish, driven by the daily moving averages indicating a bearish outlook. The weekly MACD remains bullish, but the monthly MACD is mildly bearish, suggesting mixed signals across different time frames. The Bollinger Bands are mildly bullish on both weekly and monthly charts, which adds some support to the price action. However, the KST shows a bullish weekly trend but is mildly bearish monthly, further contributing to the overall mixed sentiment. The Dow Theory indicates a mildly bearish stance on the weekly chart, while the monthly shows no trend. Overall, the bearish indicators outweigh the bullish ones, leading to a mildly bearish outlook.

View full answer

How has been the historical performance of Gokaldas Exports?

01-Dec-2025

Gokaldas Exports has shown significant growth in net sales, increasing from 1,174.52 Cr in March 2019 to 3,864.24 Cr in March 2025, with substantial improvements in profitability and total assets during the same period. The company's operating profit rose to 423.90 Cr and profit after tax reached 158.54 Cr by March 2025, reflecting successful operational strategies.

Answer:<BR>The historical performance of Gokaldas Exports shows significant growth in net sales and profitability over the years, culminating in the fiscal year ending March 2025.<BR><BR>Breakdown:<BR>Gokaldas Exports has demonstrated a strong upward trend in net sales, increasing from 1,174.52 Cr in March 2019 to 3,864.24 Cr in March 2025. This growth is reflected in total operating income, which rose from 1,174.52 Cr in March 2019 to 3,864.24 Cr in March 2025. The company's operating profit (PBDIT) also saw substantial growth, reaching 423.90 Cr in March 2025, compared to 83.48 Cr in March 2019. Profit before tax increased from 25.08 Cr in March 2019 to 218.07 Cr in March 2025, while profit after tax reached 158.54 Cr in March 2025, up from 25.58 Cr in March 2019. The company's total assets grew significantly from 923.98 Cr in March 2019 to 3,499.99 Cr in March 2025, indicating a robust expansion in its financial base. Total liabilities also increased, from 923.98 Cr in March 2019 to 3,499.99 Cr in March 2025, reflecting the company's growth strategy. Cash flow from operating activities improved, showing a net cash inflow of 110.00 Cr in March 2025, compared to a net outflow of 9.00 Cr in March 2021. Overall, Gokaldas Exports has shown a consistent improvement in its financial metrics, highlighting its successful operational and strategic initiatives over the years.

View full answer

Is Gokaldas Exports overvalued or undervalued?

14-Nov-2025

As of November 13, 2025, Gokaldas Exports is considered overvalued with a PE ratio of 43.42 and an EV to EBITDA of 18.54, making it expensive compared to peers like Trident and K P R Mill Ltd, despite a recent 1-week return of 8.18%.

As of 13 November 2025, Gokaldas Exports has moved from a valuation grade of very expensive to expensive. The company is currently considered overvalued based on its key financial ratios, including a PE ratio of 43.42, an EV to EBITDA of 18.54, and a PEG ratio of 2.99. These figures indicate that the stock is priced significantly higher than its earnings growth potential.<BR><BR>In comparison to its peers, Gokaldas Exports' valuation stands out as expensive, especially when compared to Trident, which has a PE ratio of 33.64 and an EV to EBITDA of 15.99, and K P R Mill Ltd, which is categorized as very expensive with a PE of 44.36. Despite recent stock performance showing a 1-week return of 8.18% compared to the Sensex's 1.40%, the overall valuation metrics suggest that Gokaldas Exports is not a compelling investment at its current price level.

View full answer

Who are the top shareholders of the Gokaldas Exports?

06-Jun-2025

The top shareholders of Gokaldas Exports include mutual funds (30.14%), foreign institutional investors (25.79%), and individual investors (19.24%). Clear Wealth Consultancy Services LLP is the largest promoter with 9.03%, while Nippon Life India Trustee Ltd is the largest public shareholder at 7.55%.

The top shareholders of Gokaldas Exports include a mix of mutual funds, foreign institutional investors (FIIs), and individual investors. The majority of the shares are held by mutual funds, accounting for 30.14% of the total shares through 17 different schemes. Foreign institutional investors hold 25.79% of the shares, represented by 114 FIIs.<BR><BR>Among the promoters, Clear Wealth Consultancy Services LLP has the highest holding at 9.03%. The highest public shareholder is Nippon Life India Trustee Ltd, which holds 7.55%. Additionally, individual investors collectively hold 19.24% of the shares.

View full answer

Has Gokaldas Exports declared dividend?

06-Jun-2025

Yes, Gokaldas Exports Ltd has declared a 20% dividend (₹1 per share) with an ex-date of September 13, 2023. While the dividend yield is 0%, the company has shown strong price returns, particularly a total return of 2716.59% over the past 5 years.

Gokaldas Exports Ltd has declared a 20% dividend.<BR><BR>Dividend Details:<BR>- Percentage announced: 20%<BR>- Amount per share: 1<BR>- Ex-date: 13 Sep 23<BR><BR>Dividend Yield: 0%<BR><BR>Total Returns by Period:<BR>In the last 6 months, Gokaldas Exports experienced a price return of -3.29%, with no dividend return, resulting in a total return of -3.29%.<BR><BR>Over the past year, the company had a price return of 10.1% and no dividend return, leading to a total return of 10.1%.<BR><BR>In the 2-year period, the price return was 105.03% with a dividend return of 0.21%, culminating in a total return of 105.24%.<BR><BR>For the 3-year period, Gokaldas Exports saw a price return of 109.85% and a dividend return of 0.29%, resulting in a total return of 110.14%.<BR><BR>In the last 4 years, the company achieved a price return of 530.26% with a dividend return of 0.70%, leading to a total return of 530.96%.<BR><BR>Finally, over the past 5 years, Gokaldas Exports recorded a remarkable price return of 2714.05% along with a dividend return of 2.54%, resulting in a total return of 2716.59%.<BR><BR>Overall, Gokaldas Exports has declared a dividend while also demonstrating significant price returns over longer periods, although the dividend yield remains low. The total returns indicate strong performance, particularly over the 5-year horizon.

View full answer
iScoreScore
Click here to find our call on this stock
Strong Sell
Sell
Hold
Buy
Strong Buy

Dashboard

1

The company has declared Negative results for the last 4 consecutive quarters

  • PAT(9M) At Rs 94.87 cr has Grown at -34.42%
  • ROCE(HY) Lowest at 7.77%
  • DEBTORS TURNOVER RATIO(HY) Lowest at 6.63 times
2

With ROCE of 6.3, it has a Very Expensive valuation with a 2 Enterprise value to Capital Employed

3

96.28% of Promoter Shares are Pledged

4

Consistent Underperformance against the benchmark over the last 3 years

stock-summaryMojo Parameters

Mojo Parameters

Loading Valuation Snapshot...

Stock DNA

stock-summary
Industry

Garments & Apparels

stock-summary
Market cap

INR 5,335 Cr (Small Cap)

stock-summary
P/E

52.00

stock-summary
Industry P/E

52

stock-summary
Dividend Yield

0.00%

stock-summary
Debt Equity

0.39

stock-summary
Return on Equity

4.63%

stock-summary
Price to Book

2.46

Revenue and Profits:
Net Sales:
1,154 Cr
(Quarterly Results - Jun 2026)
Net Profit:
44 Cr
stock-summaryTotal Returns
Total Returns (Price + Dividend) stock-summary
Dividend Yield (0%)
TimePeriod
Price Return
Dividend Return
Total Return
3 Months
-7.37%
0%
-7.37%
6 Months
22.09%
0%
22.09%
1 Year
-11.46%
0%
-11.46%
2 Years
-22.76%
0%
-22.76%
3 Years
-4.57%
0%
-4.57%
4 Years
115.18%
0.26%
115.44%
5 Years
269.76%
0.45%
270.21%

Latest dividend: 1 per share ex-dividend date: Sep-13-2023

Risk Adjusted Returns v/s stock-summary
Returns Beta
Icon
Beta has not been calculated since enough price history is not available
stock-summaryNews & Corporate Actions

News

Announcements stock-summary

Announcement under Regulation 30 (LODR)-Analyst / Investor Meet - Intimation

16-Sep-2026 | Source : BSE

Schedule of meeting with Institutional Investors/Research Analysts to be held on September 21 2026.

Announcement under Regulation 30 (LODR)-Analyst / Investor Meet - Intimation

13-Sep-2026 | Source : BSE

Schedule of meeting with Institutional Investors/Research Analysts to be held on September 17 2026 and September 18 2026.

Reg. 34 (1) Annual Report.

06-Sep-2026 | Source : BSE

Updated Annual Report for the Financial Year 2025-26.

Corporate Actions stock-summary

stock-summary
BOARD MEETING

No Upcoming Board Meetings

stock-summary
DIVIDEND

Gokaldas Exports Ltd has declared 20% dividend, ex-date: 13 Sep 23

stock-summary
SPLITS

Gokaldas Exports Ltd has announced 5:10 stock split, ex-date: 08 Feb 07

stock-summary
BONUS

No Bonus history available

stock-summary
RIGHTS

No Rights history available

stock-summaryKey Factors

Quality key factors stock-summary

Factor
Value
Sales Growth (5y)
28.03%
EBIT Growth (5y)
31.11%
EBIT to Interest (avg)
4.26
Debt to EBITDA (avg)
2.05
Net Debt to Equity (avg)
0.39
Sales to Capital Employed (avg)
1.62
Tax Ratio
42.05%
Dividend Payout Ratio
4.51%
Pledged Shares
96.28%
Institutional Holding
57.87%
ROCE (avg)
17.05%
ROE (avg)
11.58%

Valuation key factors

Factor
Value
P/E Ratio
52
Industry P/E
52
Price to Book Value
2.46
EV to EBIT
31.27
EV to EBITDA
16.64
EV to Capital Employed
2.05
EV to Sales
1.47
PEG Ratio
NA
Dividend Yield
NA
ROCE (Latest)
6.26%
ROE (Latest)
4.63%

Technicals key factors

Indicator
Weekly
Monthly
MACD
Mildly Bearish
Mildly Bullish
RSI
No Signal
No Signal
Bollinger Bands
Bearish
Bearish
Moving Averages
Mildly Bullish (Daily)
KST
Mildly Bearish
Bearish
Dow Theory
Mildly Bearish
Mildly Bearish
OBV
Mildly Bullish
No Trend
stock-summary Technical Indicator Scale: Bearish, Mildly Bearish, Sideways, Mildly Bullish, Bullish  Turned 
stock-summaryShareholding
Shareholding Snapshot : Jun 2026stock-summary
Shareholding Compare (%holding) stock-summary
Majority shareholders

Mutual Funds

Pledged Promoter Holdings

96.2807

Mutual Funds

Held by 19 Schemes (34.58%)

FIIs

Held by 89 FIIs (14.46%)

Promoter with highest holding

Clear Wealth Consultancy Services Llp (8.81%)

Highest Public shareholder

Nippon Life India Trustee Ltd-a/c Nippon India Sma (7.42%)

Individual Investors Holdings

22.8%

stock-summaryFinancial
[
  {
    "link": "quarterly",
    "btn_text": "All Quarterly Results",
    "header": "Quarterly Results Snapshot (Consolidated) - Jun'26 - YoY",
    "rhs": [
      {
        "prefix": "Net Sales ",
        "suffix": "YoY Growth in quarter ended Jun 2026 is 20.69% vs 2.54% in Jun 2025",
        "dir": 1
      },
      {
        "prefix": "Consolidated Net Profit ",
        "suffix": "YoY Growth in quarter ended Jun 2026 is 6.82% vs 52.58% in Jun 2025",
        "dir": -1
      }
    ],
    "table": {
      "header": [
        "Jun'26",
        "Jun'25",
        "Change(%)"
      ],
      "body": [
        {
          "field": "Net Sales",
          "val1": "1,153.51",
          "val2": "955.79",
          "chgp": "20.69%",
          "chgp_class": "positive"
        },
        {
          "field": "Operating Profit (PBDIT) excl Other Income",
          "val1": "112.50",
          "val2": "97.30",
          "chgp": "15.62%",
          "chgp_class": "positive"
        },
        {
          "field": "Interest",
          "val1": "30.51",
          "val2": "22.49",
          "chgp": "35.66%",
          "chgp_class": "negative"
        },
        {
          "field": "Exceptional Items",
          "val1": "0.00",
          "val2": "0.00",
          "chgp": "",
          "chgp_class": "neutral"
        },
        {
          "field": "Consolidate Net Profit",
          "val1": "44.30",
          "val2": "41.47",
          "chgp": "6.82%",
          "chgp_class": "positive"
        },
        {
          "field": "Operating Profit Margin (Excl OI)",
          "val1": "9.75%",
          "val2": "10.18%",
          "chgp": "-0.43%",
          "chgp_class": "negative"
        }
      ]
    }
  },
  {
    "link": "half-yearly",
    "btn_text": "All Half Yearly Results",
    "header": "Half Yearly Results Snapshot (Consolidated) - Sep'25",
    "rhs": [
      {
        "prefix": "Net Sales ",
        "suffix": " Growth in half year ended Sep 2025 is 4.24% vs 83.38% in Sep 2024",
        "dir": -1
      },
      {
        "prefix": "Consolidated Net Profit ",
        "suffix": " Growth in half year ended Sep 2025 is -10.44% vs -1.65% in Sep 2024",
        "dir": -1
      }
    ],
    "table": {
      "header": [
        "Sep'25",
        "Sep'24",
        "Change(%)"
      ],
      "body": [
        {
          "field": "Net Sales",
          "val1": "1,940.14",
          "val2": "1,861.14",
          "chgp": "4.24%",
          "chgp_class": "positive"
        },
        {
          "field": "Operating Profit (PBDIT) excl Other Income",
          "val1": "161.91",
          "val2": "144.52",
          "chgp": "12.03%",
          "chgp_class": "positive"
        },
        {
          "field": "Interest",
          "val1": "44.75",
          "val2": "36.78",
          "chgp": "21.67%",
          "chgp_class": "negative"
        },
        {
          "field": "Exceptional Items",
          "val1": "0.00",
          "val2": "0.00",
          "chgp": "",
          "chgp_class": "neutral"
        },
        {
          "field": "Consolidate Net Profit",
          "val1": "49.56",
          "val2": "55.34",
          "chgp": "-10.44%",
          "chgp_class": "negative"
        },
        {
          "field": "Operating Profit Margin (Excl OI)",
          "val1": "8.35%",
          "val2": "7.77%",
          "chgp": "0.58%",
          "chgp_class": "positive"
        }
      ]
    }
  },
  {
    "link": "nine-monthly",
    "btn_text": "All Nine Monthly Results",
    "header": "Nine Monthly Results Snapshot (Consolidated) - Dec'25",
    "rhs": [
      {
        "prefix": "Net Sales ",
        "suffix": "YoY Growth in nine months ended Dec 2025 is 2.45% vs 81.87% in Dec 2024",
        "dir": -1
      },
      {
        "prefix": "Consolidated Net Profit ",
        "suffix": "YoY Growth in nine months ended Dec 2025 is -39.28% vs 21.91% in Dec 2024",
        "dir": -1
      }
    ],
    "table": {
      "header": [
        "Dec'25",
        "Dec'24",
        "Change(%)"
      ],
      "body": [
        {
          "field": "Net Sales",
          "val1": "2,918.79",
          "val2": "2,848.91",
          "chgp": "2.45%",
          "chgp_class": "positive"
        },
        {
          "field": "Operating Profit (PBDIT) excl Other Income",
          "val1": "238.83",
          "val2": "248.43",
          "chgp": "-3.86%",
          "chgp_class": "negative"
        },
        {
          "field": "Interest",
          "val1": "68.75",
          "val2": "55.95",
          "chgp": "22.88%",
          "chgp_class": "negative"
        },
        {
          "field": "Exceptional Items",
          "val1": "0.00",
          "val2": "0.00",
          "chgp": "",
          "chgp_class": "neutral"
        },
        {
          "field": "Consolidate Net Profit",
          "val1": "64.17",
          "val2": "105.68",
          "chgp": "-39.28%",
          "chgp_class": "negative"
        },
        {
          "field": "Operating Profit Margin (Excl OI)",
          "val1": "8.18%",
          "val2": "8.72%",
          "chgp": "-0.54%",
          "chgp_class": "negative"
        }
      ]
    }
  },
  {
    "link": "annual",
    "btn_text": "All Annual Results",
    "header": "Annual Results Snapshot (Consolidated) - Mar'26",
    "rhs": [
      {
        "prefix": "Net Sales ",
        "suffix": "YoY Growth in year ended Mar 2026 is 3.19% vs 62.44% in Mar 2025",
        "dir": -1
      },
      {
        "prefix": "Consolidated Net Profit ",
        "suffix": "YoY Growth in year ended Mar 2026 is -36.84% vs 21.05% in Mar 2025",
        "dir": -1
      }
    ],
    "table": {
      "header": [
        "Mar'26",
        "Mar'25",
        "Change(%)"
      ],
      "body": [
        {
          "field": "Net Sales",
          "val1": "3,987.64",
          "val2": "3,864.24",
          "chgp": "3.19%",
          "chgp_class": "positive"
        },
        {
          "field": "Operating Profit (PBDIT) excl Other Income",
          "val1": "356.36",
          "val2": "370.96",
          "chgp": "-3.94%",
          "chgp_class": "negative"
        },
        {
          "field": "Interest",
          "val1": "95.16",
          "val2": "77.43",
          "chgp": "22.90%",
          "chgp_class": "negative"
        },
        {
          "field": "Exceptional Items",
          "val1": "0.00",
          "val2": "0.00",
          "chgp": "",
          "chgp_class": "neutral"
        },
        {
          "field": "Consolidate Net Profit",
          "val1": "100.13",
          "val2": "158.54",
          "chgp": "-36.84%",
          "chgp_class": "negative"
        },
        {
          "field": "Operating Profit Margin (Excl OI)",
          "val1": "8.94%",
          "val2": "9.60%",
          "chgp": "-0.66%",
          "chgp_class": "negative"
        }
      ]
    }
  }
]

Quarterly Results Snapshot (Consolidated) - Jun'26 - YoYstock-summary

Jun'26
Jun'25
Change(%)
Net Sales
1,153.51
955.79
20.69%
Operating Profit (PBDIT) excl Other Income
112.50
97.30
15.62%
Interest
30.51
22.49
35.66%
Exceptional Items
0.00
0.00
Consolidate Net Profit
44.30
41.47
6.82%
Operating Profit Margin (Excl OI)
9.75%
10.18%
-0.43%
Values in Rs Cr.
Direction Arrows
Net Sales

YoY Growth in quarter ended Jun 2026 is 20.69% vs 2.54% in Jun 2025

Direction Arrows
Consolidated Net Profit

YoY Growth in quarter ended Jun 2026 is 6.82% vs 52.58% in Jun 2025

Half Yearly Results Snapshot (Consolidated) - Sep'25stock-summary

Sep'25
Sep'24
Change(%)
Net Sales
1,940.14
1,861.14
4.24%
Operating Profit (PBDIT) excl Other Income
161.91
144.52
12.03%
Interest
44.75
36.78
21.67%
Exceptional Items
0.00
0.00
Consolidate Net Profit
49.56
55.34
-10.44%
Operating Profit Margin (Excl OI)
8.35%
7.77%
0.58%
Values in Rs Cr.
Direction Arrows
Net Sales

Growth in half year ended Sep 2025 is 4.24% vs 83.38% in Sep 2024

Direction Arrows
Consolidated Net Profit

Growth in half year ended Sep 2025 is -10.44% vs -1.65% in Sep 2024

Nine Monthly Results Snapshot (Consolidated) - Dec'25stock-summary

Dec'25
Dec'24
Change(%)
Net Sales
2,918.79
2,848.91
2.45%
Operating Profit (PBDIT) excl Other Income
238.83
248.43
-3.86%
Interest
68.75
55.95
22.88%
Exceptional Items
0.00
0.00
Consolidate Net Profit
64.17
105.68
-39.28%
Operating Profit Margin (Excl OI)
8.18%
8.72%
-0.54%
Values in Rs Cr.
Direction Arrows
Net Sales

YoY Growth in nine months ended Dec 2025 is 2.45% vs 81.87% in Dec 2024

Direction Arrows
Consolidated Net Profit

YoY Growth in nine months ended Dec 2025 is -39.28% vs 21.91% in Dec 2024

Annual Results Snapshot (Consolidated) - Mar'26stock-summary

Mar'26
Mar'25
Change(%)
Net Sales
3,987.64
3,864.24
3.19%
Operating Profit (PBDIT) excl Other Income
356.36
370.96
-3.94%
Interest
95.16
77.43
22.90%
Exceptional Items
0.00
0.00
Consolidate Net Profit
100.13
158.54
-36.84%
Operating Profit Margin (Excl OI)
8.94%
9.60%
-0.66%
Values in Rs Cr.
Direction Arrows
Net Sales

YoY Growth in year ended Mar 2026 is 3.19% vs 62.44% in Mar 2025

Direction Arrows
Consolidated Net Profit

YoY Growth in year ended Mar 2026 is -36.84% vs 21.05% in Mar 2025

stock-summaryCompany CV
About Gokaldas Exports Ltd stock-summary
stock-summary
Gokaldas Exports Ltd
Small Cap
Garments & Apparels
Gokaldas Exports Limited (GEL) was incorporated on March 1, 2004 by converting the erstwhile partnership firm Gokaldas India. Gokaldas Exports is one of India's leading apparel manufacturers and exporters, serving some of the world's most recognised fashion and lifestyle brands. Operating across the apparel value chain, the Company brings design, product development, sourcing, manufacturing, value added processing and delivery together on one integrated platform.
Company Coordinates stock-summary
Company Details
16/2 Prestige Dot Com, Residency Road Bangalore Karnataka : 560025
stock-summary
Tel: 91-080-22223600/01/02/41272200
stock-summary
investorcare@gokaldasexports.com
Registrar Details
Karvy Computershare Pvt Ltd, Plot No 17-24 , Near Image Hospital,, Reliance Cybervilae,Vithalrao Nagar,, Madhapur, Hyderabad