
Compare Roselabs Finance with Similar Stocks
Dashboard
With a Negative Book Value, the company has a Weak Long Term Fundamental Strength
- Poor long term growth as Net Sales has grown by an annual rate of 30.30% and Operating profit at 0%
Flat results in Jun 26
Risky - Negative EBITDA
Consistent Underperformance against the benchmark over the last 3 years
Stock DNA
Non Banking Financial Company (NBFC)
INR 23 Cr (Micro Cap)
NA (Loss Making)
21
0.00%
-1.02
6.42%
-4.76
Total Returns (Price + Dividend) 
Roselabs Finance for the last several years.
Risk Adjusted Returns v/s
Returns Beta

News
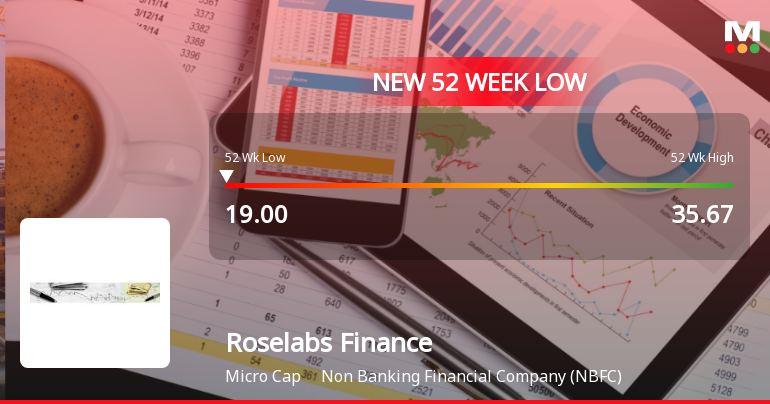
Five Consecutive Losses Push Roselabs Finance Ltd to a New 52-Week Low
For the fifth consecutive session, Roselabs Finance Ltd closed lower, slipping to a fresh 52-week low of Rs 19 on 21 May 2026. This marks a 16.3% decline over the last four trading days, underscoring persistent selling pressure despite a broadly positive market backdrop.
Read full news article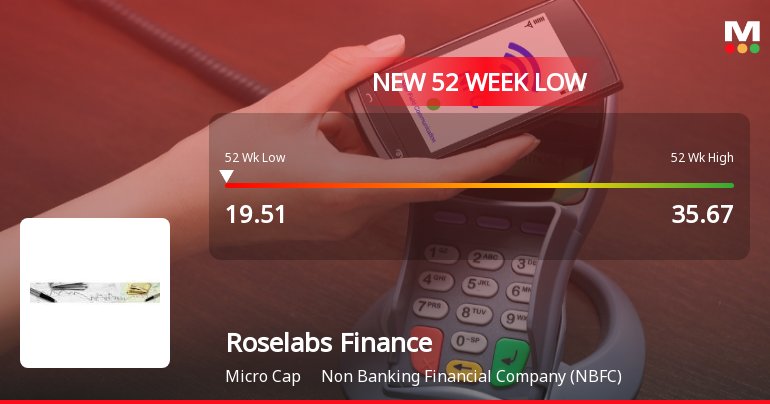
Roselabs Finance Ltd Falls to 52-Week Low of Rs 19.51 as Sell-Off Deepens
For the third consecutive session, Roselabs Finance Ltd has seen its share price decline, culminating in a fresh 52-week low of Rs 19.51 on 20 May 2026. This marks a 14.05% drop over the last three days, underscoring persistent selling pressure amid a backdrop of weak fundamentals and challenging market conditions.
Read full news article Announcements
Announcement under Regulation 30 (LODR)-Newspaper Publication
29-Jul-2026 | Source : BSENewspaper advertisement regarding 32nd Annual General Meeting of the Company.
Reg. 34 (1) Annual Report.
28-Jul-2026 | Source : BSE32nd Annual Report of Roselabs Finance Limited
Notice Of 32Nd Annual General Meeting Of Roselabs Finance Limited
28-Jul-2026 | Source : BSENotice of 32nd Annual General Meeting of Roselabs Finance Limited is enclosed herewith
Corporate Actions

No Upcoming Board Meetings

No Dividend history available

No Splits history available

No Bonus history available

No Rights history available
Quality key factors
Valuation key factors
Technicals key factors
 Technical Indicator Scale: Bearish, Mildly Bearish, Sideways, Mildly Bullish, Bullish Turned
 Shareholding Snapshot : Jun 2026
Shareholding Compare (%holding)
Promoters
None
Held by 0 Schemes
Held by 0 FIIs
Lodha Developers Limited (74.25%)
Arhanathji Builders And Farms Pvt Ltd (4.96%)
15.14%
Quarterly Results Snapshot (Standalone) - Jun'26 - QoQ

QoQ Growth in quarter ended Jun 2026 is 0.00% vs -100.00% in Mar 2026
QoQ Growth in quarter ended Jun 2026 is 68.75% vs -300.00% in Mar 2026
Half Yearly Results Snapshot (Standalone) - Sep'25
Growth in half year ended Sep 2025 is 0.00% vs 0.00% in Sep 2024
Growth in half year ended Sep 2025 is 21.43% vs -40.00% in Sep 2024
Nine Monthly Results Snapshot (Standalone) - Dec'25
YoY Growth in nine months ended Dec 2025 is 0.00% vs 0.00% in Dec 2024
YoY Growth in nine months ended Dec 2025 is 40.00% vs -92.31% in Dec 2024
Annual Results Snapshot (Standalone) - Mar'26
YoY Growth in year ended Mar 2026 is 70.42% vs -37.72% in Mar 2025
YoY Growth in year ended Mar 2026 is -6.90% vs -123.08% in Mar 2025
About Roselabs Finance Ltd

Company Coordinates


