
Compare Roselabs Finance with Similar Stocks
Stock DNA
Non Banking Financial Company (NBFC)
INR 20 Cr (Micro Cap)
NA (Loss Making)
85
0.00%
-1.02
6.42%
-4.33
Total Returns (Price + Dividend) 
Roselabs Finance for the last several years.
Risk Adjusted Returns v/s
Returns Beta

News
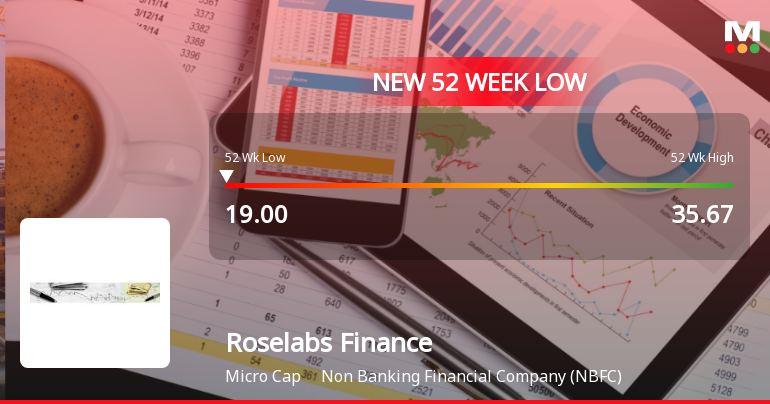
Five Consecutive Losses Push Roselabs Finance Ltd to a New 52-Week Low
For the fifth consecutive session, Roselabs Finance Ltd closed lower, slipping to a fresh 52-week low of Rs 19 on 21 May 2026. This marks a 16.3% decline over the last four trading days, underscoring persistent selling pressure despite a broadly positive market backdrop.
Read full news article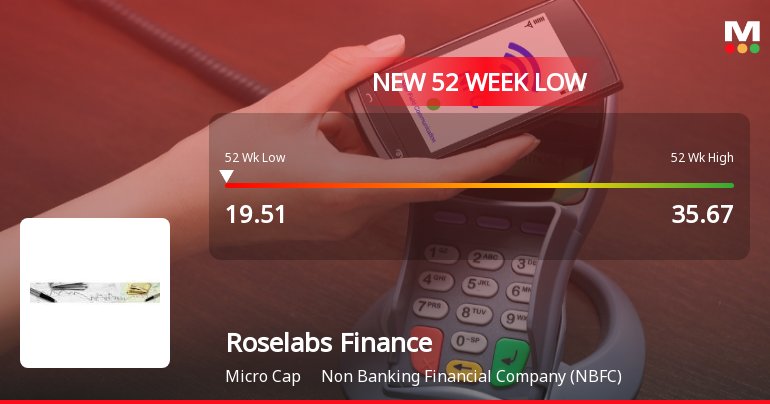
Roselabs Finance Ltd Falls to 52-Week Low of Rs 19.51 as Sell-Off Deepens
For the third consecutive session, Roselabs Finance Ltd has seen its share price decline, culminating in a fresh 52-week low of Rs 19.51 on 20 May 2026. This marks a 14.05% drop over the last three days, underscoring persistent selling pressure amid a backdrop of weak fundamentals and challenging market conditions.
Read full news articleAre Roselabs Finance Ltd latest results good or bad?
The latest financial results for Roselabs Finance Ltd for Q4 FY26 indicate significant operational challenges. The company reported net sales of ₹0.00 crores, marking a complete absence of revenue generation, which is a stark contrast to the ₹1.21 crores recorded in the previous quarter. This trend of zero sales has persisted across multiple quarters, highlighting the company's struggle to maintain its core business activities as a non-banking financial company (NBFC). In terms of profitability, Roselabs Finance Ltd incurred a net loss of ₹0.16 crores in Q4 FY26, which is a notable decline from the loss of ₹0.04 crores in Q3 FY26. This deterioration was exacerbated by an unusual tax charge, leading to a negative tax rate that raises concerns about potential legacy tax liabilities. The operating profit before interest, depreciation, and tax (PBDIT) also worsened slightly, reflecting ongoing operational inef...
Read full news article Announcements
Announcement under Regulation 30 (LODR)-Change in Directorate
29-May-2026 | Source : BSERe-appointment of Mr. Raghava Reddy Balineni as Managing Director of the Company
Announcement under Regulation 30 (LODR)-Newspaper Publication
17-Apr-2026 | Source : BSENewspaper publication of the audited financial results for the quarter and financial year ended March 31 2026
Audited Financial Results For The Quarter And Financial Year Ended March 31 2026
16-Apr-2026 | Source : BSEAudited Financial Results for the quarter and Financial Year ended March 31 2026
Corporate Actions

No Upcoming Board Meetings

No Dividend history available

No Splits history available

No Bonus history available

No Rights history available
Quality key factors
Valuation key factors
Technicals key factors
 Technical Indicator Scale: Bearish, Mildly Bearish, Sideways, Mildly Bullish, Bullish Turned
 Shareholding Snapshot : Mar 2026
Shareholding Compare (%holding)
Promoters
None
Held by 0 Schemes
Held by 0 FIIs
Lodha Developers Limited (74.25%)
Arhanathji Builders And Farms Pvt Ltd (4.96%)
15.14%
Quarterly Results Snapshot (Standalone) - Mar'26 - QoQ

QoQ Growth in quarter ended Mar 2026 is -100.00% vs 0.00% in Dec 2025
QoQ Growth in quarter ended Mar 2026 is -300.00% vs 33.33% in Dec 2025
Half Yearly Results Snapshot (Standalone) - Sep'25
Growth in half year ended Sep 2025 is 0.00% vs 0.00% in Sep 2024

Growth in half year ended Sep 2025 is 21.43% vs -40.00% in Sep 2024
Nine Monthly Results Snapshot (Standalone) - Dec'25
YoY Growth in nine months ended Dec 2025 is 0.00% vs 0.00% in Dec 2024
YoY Growth in nine months ended Dec 2025 is 40.00% vs -92.31% in Dec 2024
Annual Results Snapshot (Standalone) - Mar'26
YoY Growth in year ended Mar 2026 is 70.42% vs -37.72% in Mar 2025
YoY Growth in year ended Mar 2026 is -6.90% vs -123.08% in Mar 2025
About Roselabs Finance Ltd

Company Coordinates


