
Compare Niraj Cement with Similar Stocks
Total Returns (Price + Dividend) 
Latest dividend: 0.5 per share ex-dividend date: Sep-22-2011
Risk Adjusted Returns v/s
Returns Beta

News

Niraj Cement Structurals Ltd is Rated Sell
Niraj Cement Structurals Ltd is rated 'Sell' by MarketsMOJO, with this rating last updated on 10 February 2026. However, the analysis and financial metrics discussed here reflect the stock's current position as of 05 July 2026, providing investors with an up-to-date view of the company’s performance and outlook.
Read full news article
Niraj Cement Structurals Ltd is Rated Sell
Niraj Cement Structurals Ltd is rated Sell by MarketsMOJO, with this rating last updated on 10 February 2026. However, the analysis and financial metrics discussed here reflect the stock’s current position as of 24 June 2026, providing investors with an up-to-date view of the company’s fundamentals, returns, and market standing.
Read full news article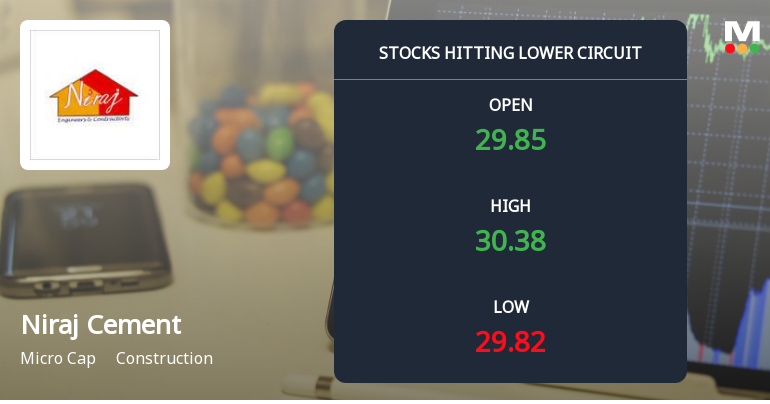
Niraj Cement Structurals Ltd Locks at Lower Circuit With 4.99% Loss — Sellers Queue, No Buyers in Sight
At Rs 30.85, sellers were still queuing — but there were no buyers willing to take the other side. Niraj Cement Structurals Ltd locked at its lower circuit of 4.99% on 23 Jun 2026, with unfilled sell orders and a frozen price, signalling a pronounced imbalance in supply and demand.
Read full news article Announcements
Draft Letter of Offer
01-Jul-2026 | Source : BSENavigant Corporate Advisors Ltd (Manager to the Offer) has submitted to BSE a copy of Draft Letter of Offer to the Shareholders of Niraj Cement Structurals Ltd (Target Company).
Shareholder Meeting / Postal Ballot-Scrutinizers Report
01-Jul-2026 | Source : BSEPlease find herewith the E voting results of postal ballot along with the Scrutinizers Report.
Shareholder Meeting / Postal Ballot-Scrutinizers Report
01-Jul-2026 | Source : BSEPlease find herewith the E-voting results of the Postal Ballot along with the Scrutinizers Report.
Corporate Actions

No Upcoming Board Meetings

Niraj Cement Structurals Ltd has declared 5% dividend, ex-date: 22 Sep 11

No Splits history available

No Bonus history available

No Rights history available
Quality key factors
Valuation key factors
Technicals key factors
 Technical Indicator Scale: Bearish, Mildly Bearish, Sideways, Mildly Bullish, Bullish Turned
 Shareholding Snapshot : Mar 2026
Shareholding Compare (%holding)
Non Institution
None
Held by 0 Schemes
Held by 1 FIIs (0.09%)
Gulshan Vijaykumar Chopra (8.75%)
Bylan-niraj Infra Projects Private Limited (21.44%)
27.13%
Quarterly Results Snapshot (Consolidated) - Mar'26 - QoQ

QoQ Growth in quarter ended Mar 2026 is -2.87% vs -18.55% in Dec 2025
QoQ Growth in quarter ended Mar 2026 is -0.35% vs -35.64% in Dec 2025
Half Yearly Results Snapshot (Consolidated) - Sep'25
Growth in half year ended Sep 2025 is 20.66% vs 5.07% in Sep 2024

Growth in half year ended Sep 2025 is 106.53% vs 309.48% in Sep 2024
Nine Monthly Results Snapshot (Consolidated) - Dec'25
YoY Growth in nine months ended Dec 2025 is 19.30% vs 1.12% in Dec 2024
YoY Growth in nine months ended Dec 2025 is 123.70% vs 180.16% in Dec 2024
Annual Results Snapshot (Consolidated) - Mar'26
YoY Growth in year ended Mar 2026 is 6.88% vs 7.85% in Mar 2025
YoY Growth in year ended Mar 2026 is 40.19% vs 46.69% in Mar 2025
About Niraj Cement Structurals Ltd

Company Coordinates


