
Compare Niraj Cement with Similar Stocks
Dashboard
Flat results in Mar 26
- PBT LESS OI(Q) At Rs 1.72 cr has Fallen at -65.3% (vs previous 4Q average)
- NET SALES(Q) At Rs 135.86 cr has Fallen at -5.2% (vs previous 4Q average)
- NON-OPERATING INCOME(Q) is 78.77 % of Profit Before Tax (PBT)
Below par performance in long term as well as near term
Total Returns (Price + Dividend) 
Latest dividend: 0.5 per share ex-dividend date: Sep-22-2011
Risk Adjusted Returns v/s
Returns Beta

News

Niraj Cement Structurals Ltd is Rated Sell
Niraj Cement Structurals Ltd is rated 'Sell' by MarketsMOJO, with this rating last updated on 10 February 2026. However, the analysis and financial metrics discussed here reflect the stock’s current position as of 27 July 2026, providing investors with an up-to-date view of the company’s fundamentals, returns, and market performance.
Read full news article
Niraj Cement Structurals Ltd is Rated Sell
Niraj Cement Structurals Ltd is rated Sell by MarketsMOJO, with this rating last updated on 10 February 2026. However, the analysis and financial metrics discussed here reflect the stock’s current position as of 16 July 2026, providing investors with an up-to-date view of the company’s fundamentals, valuation, financial trend, and technical outlook.
Read full news article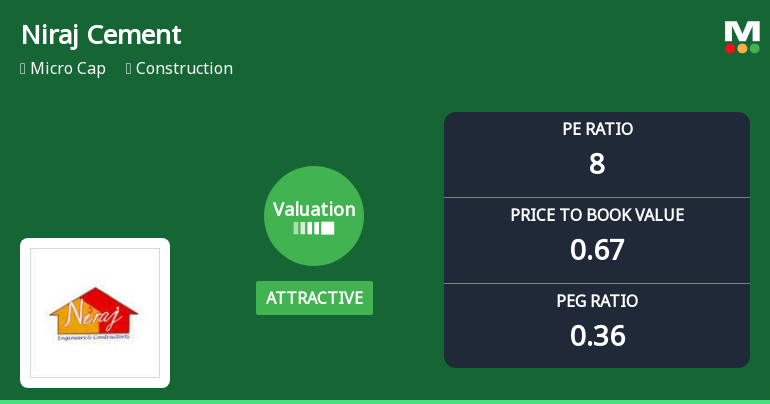
Niraj Cement Structurals Ltd: Valuation Shifts Signal Renewed Price Attractiveness
Niraj Cement Structurals Ltd has witnessed a notable improvement in its valuation parameters, shifting from very attractive to attractive territory. Despite ongoing sector headwinds and a challenging market environment, the company’s price-to-earnings (P/E) and price-to-book value (P/BV) ratios now present a more compelling case for investors seeking value in the construction industry’s micro-cap segment.
Read full news article Announcements
Outcome Of Meeting Of Committee Of Independent Directors For Open Offer Of Niraj Cement Structurals Limited
28-Jul-2026 | Source : BSEOutcome of Meeting of Committee of Independent Directors for Open Offer of Niraj Cement Structurals Limited
Letter of Offer
20-Jul-2026 | Source : BSENavigant Corporate Advisors Ltd (Manager to the Offer) has submitted to BSE a copy of Letter of Offer for the attention to the Shareholders of Niraj Cement Structurals Ltd (Target Company).
Corrigendum to Detailed Public Statement
20-Jul-2026 | Source : BSENavigant Corporate Advisors Ltd (Manager to the Offer) has submitted to BSE a copy of Corrigendum to the Detailed Public Statement for the attention to the Shareholders of Niraj Cement Structurals Ltd (Target Company).
Corporate Actions

No Upcoming Board Meetings

Niraj Cement Structurals Ltd has declared 5% dividend, ex-date: 22 Sep 11

No Splits history available

No Bonus history available

No Rights history available
Quality key factors
Valuation key factors
Technicals key factors
 Technical Indicator Scale: Bearish, Mildly Bearish, Sideways, Mildly Bullish, Bullish Turned
 Shareholding Snapshot : Jun 2026
Shareholding Compare (%holding)
Non Institution
None
Held by 0 Schemes
Held by 0 FIIs
Gulshan Vijaykumar Chopra (8.75%)
Bylan-niraj Infra Projects Private Limited (21.44%)
27.02%
Quarterly Results Snapshot (Consolidated) - Mar'26 - QoQ

QoQ Growth in quarter ended Mar 2026 is -2.87% vs -18.55% in Dec 2025
QoQ Growth in quarter ended Mar 2026 is -0.35% vs -35.64% in Dec 2025
Half Yearly Results Snapshot (Consolidated) - Sep'25
Growth in half year ended Sep 2025 is 20.66% vs 5.07% in Sep 2024

Growth in half year ended Sep 2025 is 106.53% vs 309.48% in Sep 2024
Nine Monthly Results Snapshot (Consolidated) - Dec'25
YoY Growth in nine months ended Dec 2025 is 19.30% vs 1.12% in Dec 2024
YoY Growth in nine months ended Dec 2025 is 123.70% vs 180.16% in Dec 2024
Annual Results Snapshot (Consolidated) - Mar'26
YoY Growth in year ended Mar 2026 is 6.88% vs 7.85% in Mar 2025
YoY Growth in year ended Mar 2026 is 40.19% vs 46.69% in Mar 2025
About Niraj Cement Structurals Ltd

Company Coordinates


