
Compare NHPC Ltd with Similar Stocks
Dashboard
Weak Long Term Fundamental Strength with a -4.24% CAGR growth in Operating Profits over the last 5 years
- Low ability to service debt as the company has a high Debt to EBITDA ratio of 9.99 times
- The company has been able to generate a Return on Equity (avg) of 9.33% signifying low profitability per unit of shareholders funds
Flat results in Mar 26
With ROCE of 3.6, it has a Very Expensive valuation with a 1.4 Enterprise value to Capital Employed
Total Returns (Price + Dividend) 
Latest dividend: 1.4 per share ex-dividend date: Feb-10-2026
Risk Adjusted Returns v/s
Returns Beta

News

NHPC Ltd is Rated Strong Sell
NHPC Ltd is rated Strong Sell by MarketsMOJO, with this rating last updated on 18 May 2026. However, the analysis and financial metrics discussed here reflect the stock’s current position as of 24 July 2026, providing investors with the latest insights into the company’s performance and outlook.
Read full news article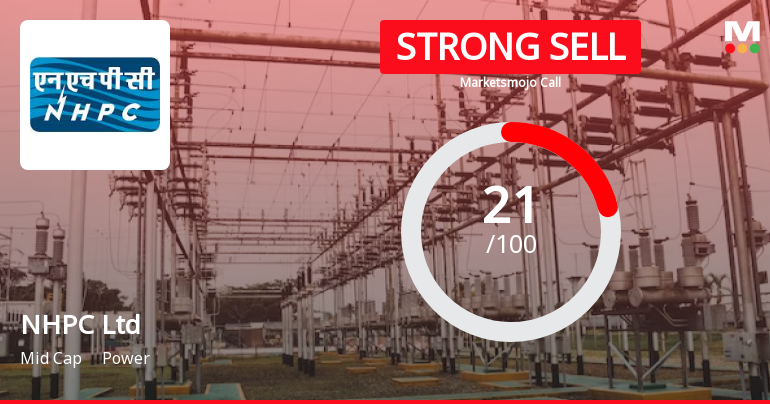
NHPC Ltd is Rated Strong Sell
NHPC Ltd is rated Strong Sell by MarketsMOJO, with this rating last updated on 18 May 2026. However, the analysis and financial metrics discussed here reflect the stock’s current position as of 13 July 2026, providing investors with an up-to-date perspective on the company’s performance and outlook.
Read full news article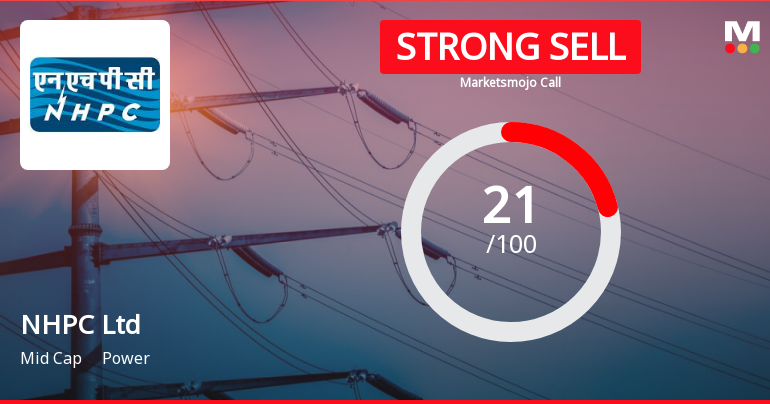
NHPC Ltd is Rated Strong Sell
NHPC Ltd is rated Strong Sell by MarketsMOJO, with this rating last updated on 18 May 2026. However, the analysis and financial metrics discussed here reflect the company’s current position as of 02 July 2026, providing investors with an up-to-date view of the stock’s fundamentals, valuation, financial trends, and technical outlook.
Read full news article Announcements
Announcement under Regulation 30 (LODR)-Newspaper Publication
22-Jul-2026 | Source : BSEIn compliance to Regulation 30 of SEBI LODR copy of notice to equity shareholders regarding transfer of equity shares to IEPF Authority published in Business Standard (English-All Editions) and Business Standard (Hindi- Delhi NCR Edition) is submitted.
Announcement under Regulation 30 (LODR)-Press Release / Media Release
21-Jul-2026 | Source : BSEIn compliance to Regulation 30 of SEBI LODR a advance copy of press release dated 21.07.2026 regarding incident at Teesta VI HE Project (500 MW) Sikkim is submitted.
Announcement under Regulation 30 (LODR)-Newspaper Publication
20-Jul-2026 | Source : BSEPublication in newspapers regarding special window for transfer and dematerialization of physical shares is submitted.
Corporate Actions

No Upcoming Board Meetings

NHPC Ltd has declared 14% dividend, ex-date: 10 Feb 26

No Splits history available

No Bonus history available

No Rights history available
Quality key factors
Valuation key factors
Technicals key factors
 Technical Indicator Scale: Bearish, Mildly Bearish, Sideways, Mildly Bullish, Bullish Turned
 Shareholding Snapshot : Jun 2026
Shareholding Compare (%holding)
Promoters
None
Held by 28 Schemes (6.85%)
Held by 536 FIIs (12.29%)
None
Life Insurance Corporation Of India - Ulif00420091 (5.04%)
9.43%
Quarterly Results Snapshot (Consolidated) - Mar'26 - YoY

YoY Growth in quarter ended Mar 2026 is 19.96% vs 24.38% in Mar 2025

YoY Growth in quarter ended Mar 2026 is 71.05% vs 56.95% in Mar 2025
Half Yearly Results Snapshot (Consolidated) - Sep'25
Growth in half year ended Sep 2025 is 14.49% vs 1.01% in Sep 2024
Growth in half year ended Sep 2025 is 8.57% vs -25.59% in Sep 2024
Nine Monthly Results Snapshot (Consolidated) - Dec'25
YoY Growth in nine months ended Dec 2025 is 9.55% vs 3.73% in Dec 2024
YoY Growth in nine months ended Dec 2025 is 7.09% vs -29.86% in Dec 2024
Annual Results Snapshot (Consolidated) - Mar'26
YoY Growth in year ended Mar 2026 is 11.90% vs 7.78% in Mar 2025
YoY Growth in year ended Mar 2026 is 25.25% vs -16.39% in Mar 2025
About NHPC Ltd

Company Coordinates


