
Compare NHPC Ltd with Similar Stocks
Dashboard
Weak Long Term Fundamental Strength with a -4.24% CAGR growth in Operating Profits over the last 5 years
- Low ability to service debt as the company has a high Debt to EBITDA ratio of 9.99 times
- The company has been able to generate a Return on Equity (avg) of 9.33% signifying low profitability per unit of shareholders funds
Flat results in Mar 26
With ROCE of 3.6, it has a Very Expensive valuation with a 1.4 Enterprise value to Capital Employed
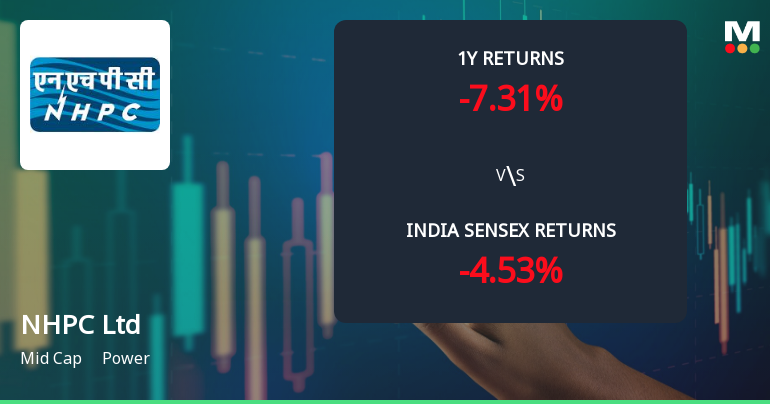
Total Returns (Price + Dividend) 
Latest dividend: 1.4 per share ex-dividend date: Feb-10-2026
Risk Adjusted Returns v/s
Returns Beta

News
NHPC Ltd Technical Momentum Shifts to Bearish Amidst Mixed Indicator Signals
NHPC Ltd, a mid-cap player in the power sector, has experienced a notable shift in its technical momentum, with key indicators signalling a bearish trend. Despite a strong long-term return profile, recent price action and technical parameters suggest caution for investors as the stock faces downward pressure amid mixed signals from momentum oscillators and moving averages.
Read full news articleWhen is the next results date for NHPC Ltd?
NHPC Ltd will declare its results on 04 August 2026....
Read full news article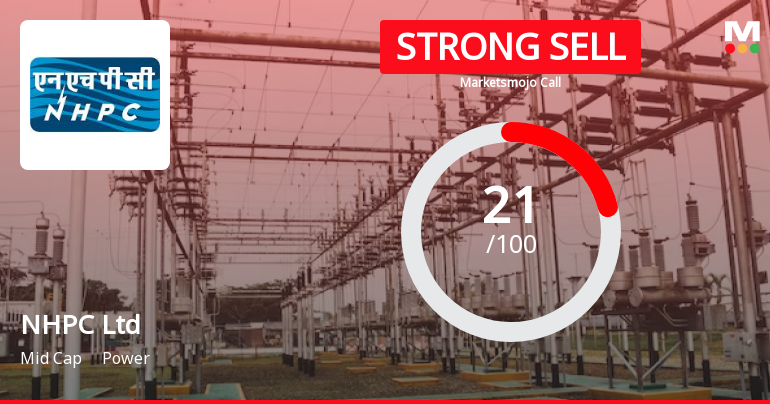
NHPC Ltd is Rated Strong Sell
NHPC Ltd is rated Strong Sell by MarketsMOJO, with this rating last updated on 18 May 2026. However, the analysis and financial metrics discussed here reflect the stock’s current position as of 24 July 2026, providing investors with the latest insights into the company’s performance and outlook.
Read full news article Announcements
Appointment Of Director (Personnel) On The Board Of NHPC Limited
27-Jul-2026 | Source : BSEIn compliance tor Regulation 30 of SEBI LODR intimation regarding convey of Ministry of Power order dated 27.07.2026 for appointment of Shri Paresh Rasiklal Ranpara to the post of Director (Personnel) NHPC Limited is submitted.
Board Meeting Intimation for Considering Un-Audited Financial Results For The Quarter Ended June 30 2026
27-Jul-2026 | Source : BSENHPC Ltdhas informed BSE that the meeting of the Board of Directors of the Company is scheduled on 04/08/2026 inter alia to consider and approve the unaudited Financial Results (Standalone and Consolidated) of the Company for the quarter ended on 30th June 2026
Announcement under Regulation 30 (LODR)-Change in Directorate
24-Jul-2026 | Source : BSEIn compliance to Regulation 30 of SEBI LODR appointment of Dr. Bernadette Lyngdoh (DIN: 11836182) as Independent Director of NHPC Limited w.e.f. 24.07.2026 is submitted. The details given in the attached letter.
Corporate Actions

04 Aug 2026

NHPC Ltd has declared 14% dividend, ex-date: 10 Feb 26

No Splits history available

No Bonus history available

No Rights history available
Quality key factors
Valuation key factors
Technicals key factors
 Technical Indicator Scale: Bearish, Mildly Bearish, Sideways, Mildly Bullish, Bullish Turned
 Shareholding Snapshot : Jun 2026
Shareholding Compare (%holding)
Promoters
None
Held by 28 Schemes (6.85%)
Held by 536 FIIs (12.29%)
None
Life Insurance Corporation Of India - Ulif00420091 (5.04%)
9.43%
Quarterly Results Snapshot (Consolidated) - Mar'26 - YoY

YoY Growth in quarter ended Mar 2026 is 19.96% vs 24.38% in Mar 2025

YoY Growth in quarter ended Mar 2026 is 71.05% vs 56.95% in Mar 2025
Half Yearly Results Snapshot (Consolidated) - Sep'25
Growth in half year ended Sep 2025 is 14.49% vs 1.01% in Sep 2024
Growth in half year ended Sep 2025 is 8.57% vs -25.59% in Sep 2024
Nine Monthly Results Snapshot (Consolidated) - Dec'25
YoY Growth in nine months ended Dec 2025 is 9.55% vs 3.73% in Dec 2024
YoY Growth in nine months ended Dec 2025 is 7.09% vs -29.86% in Dec 2024
Annual Results Snapshot (Consolidated) - Mar'26
YoY Growth in year ended Mar 2026 is 11.90% vs 7.78% in Mar 2025
YoY Growth in year ended Mar 2026 is 25.25% vs -16.39% in Mar 2025
About NHPC Ltd

Company Coordinates


