
Compare Bhanderi Infra. with Similar Stocks
Dashboard
Weak Long Term Fundamental Strength with a -3.20% CAGR growth in Net Sales over the last 5 years
- Low ability to service debt as the company has a high Debt to EBITDA ratio of 23.40 times
- The company has been able to generate a Return on Equity (avg) of 3.66% signifying low profitability per unit of shareholders funds
Flat results in Sep 23
Total Returns (Price + Dividend) 
Bhanderi Infra. for the last several years.
Risk Adjusted Returns v/s
Returns Beta

News

Bhanderi Infracon Ltd is Rated Sell
Bhanderi Infracon Ltd is rated 'Sell' by MarketsMOJO, with this rating last updated on 05 Feb 2025. However, the analysis and financial metrics discussed here reflect the stock's current position as of 20 March 2026, providing investors with an up-to-date view of the company’s fundamentals, returns, and technical outlook.
Read full news article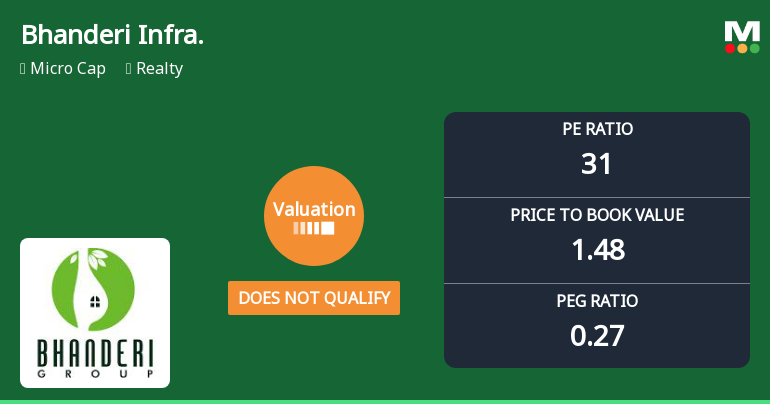
Bhanderi Infracon Ltd Valuation Shifts Signal Changing Market Sentiment
Bhanderi Infracon Ltd, a player in the Realty sector, has witnessed a notable shift in its valuation parameters, prompting a reassessment of its price attractiveness. The company’s price-to-earnings (P/E) ratio now stands at 30.6, while its price-to-book value (P/BV) is 1.48, reflecting a transition from a previously risky valuation grade to one that no longer qualifies as such. This article analyses these changes in the context of historical trends, peer comparisons, and broader market movements to provide investors with a comprehensive view of the stock’s current standing.
Read full news article
Bhanderi Infracon Ltd is Rated Sell
Bhanderi Infracon Ltd is rated 'Sell' by MarketsMOJO, with this rating last updated on 05 Feb 2025. However, the analysis and financial metrics discussed here reflect the stock's current position as of 06 March 2026, providing investors with an up-to-date view of its fundamentals, returns, and overall outlook.
Read full news article Announcements
Closure of Trading Window
27-Mar-2026 | Source : BSEIntimation of Closure of Trading Window for the declaration of financials results for the half year ended 31st March 2026
Announcement under Regulation 30 (LODR)-Change in Management
04-Feb-2026 | Source : BSEIntimation under Regulation 30 read with Part A of Schedule III of SEBI (Listing Obligations and Disclosure Requirements) Regulation 2015 Appointment of Additional (Independent ) Director
Compliances-Certificate under Reg. 74 (5) of SEBI (DP) Regulations 2018
13-Jan-2026 | Source : BSESubmission of certificate under Regulation 74(5) of the SEBI (DP) Regulations 2018 for the quarter ended 31st December 2025
Corporate Actions

No Upcoming Board Meetings

No Dividend history available

No Splits history available

No Bonus history available

No Rights history available
Quality key factors
Valuation key factors
Technicals key factors
 Technical Indicator Scale: Bearish, Mildly Bearish, Sideways, Mildly Bullish, Bullish Turned
 Shareholding Snapshot : Dec 2025
Shareholding Compare (%holding)
Promoters
None
Held by 0 Schemes
Held by 0 FIIs
Sunil Dhirubhai Patel (55.38%)
Amit Kumar Hasmukhlal Thakar (2.39%)
36.17%
About Bhanderi Infracon Ltd

Company Coordinates


