Apollo Tyres

  • Market Cap: Small Cap
  • Industry: Tyres & Rubber Products
  • ISIN: INE438A01022
  • NSEID: APOLLOTYRE
  • BSEID: 500877
INR
444.00
0.85 (0.19%)
BSENSE

Aug 14, 04:01 PM

BSE+NSE Vol: 2.93 lacs

  • Price Points
  • Score
  • Mojo Parameters
  • Total Return
  • News and Corporate Actions
  • Key factors
  • Shareholding
  • Financials
  • CompanyCV
stock-summaryPrice Point
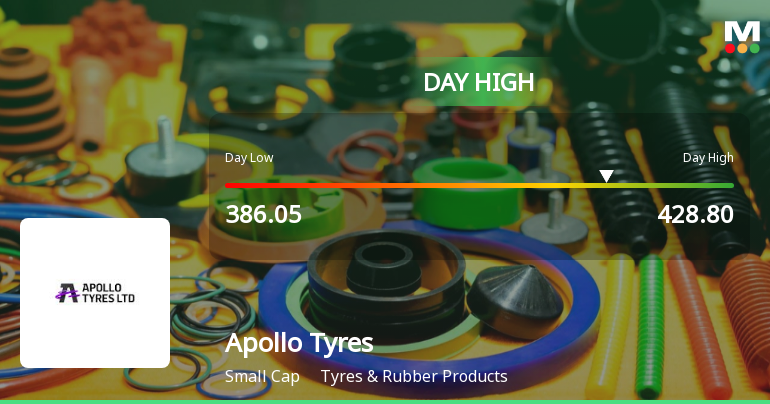
High/Low

1Day

52 Week

Valuation
Technical
Day's Volume

CASH

2.93 lacs (-39.47%) Volume

Shareholding (Jun 2026)

FII

10.08%

Held by 224 FIIs

DII

30.62%

Held by 63 DIIs

Promoter

36.93%

Why is Apollo Tyres Ltd. falling/rising?

15-Aug-2026

As of 14-Aug, Apollo Tyres Ltd. is seeing a slight stock price increase to 444.00, driven by strong recent financial performance and attractive valuation metrics. However, concerns about long-term growth and declining investor participation persist.

As of 14-Aug, Apollo Tyres Ltd. is experiencing a slight rise in its stock price, currently at 444.00, reflecting a change of 0.85 (0.19%) upward. This positive movement can be attributed to several factors. The company has demonstrated strong financial performance, having declared positive results for the last three consecutive quarters, with a profit after tax (PAT) of Rs 1,418.41 crore in the latest six months. Additionally, Apollo Tyres has a low debt to EBITDA ratio of 0.89 times and a debt-equity ratio of 0.22 times, indicating a strong ability to service its debt.<BR><BR>Furthermore, the stock is trading at a discount compared to its peers' average historical valuations, which may attract investors looking for value. The company has also shown impressive profit growth, with profits rising by 118.1% over the past year, while the stock itself generated a return of 2.60%. The PEG ratio of 0.1 suggests that the stock is undervalued relative to its earnings growth potential.<BR><BR>However, it is important to note that there are some negative indicators as well. The stock has seen a decline in investor participation, with delivery volume falling by 44.45% against the 5-day average. Additionally, while the stock has performed well in the short term, its long-term growth prospects are considered poor, with operating profit growth at an annual rate of only 8.52% over the last five years.<BR><BR>In summary, the rise in Apollo Tyres Ltd.'s stock price is supported by strong recent financial performance and attractive valuation metrics, despite some concerns regarding long-term growth and declining investor participation.

View full answer

Who are in the management team of Apollo Tyres?

14-Aug-2026

The management team of Apollo Tyres includes Chairman Onkar S Kanwar, Vice Chairman & Managing Director Neeraj Kanwar, and several directors such as Satish Sharma, Robert Steinmetz, and Sunam Sarkar, along with independent directors and Company Secretary Seema Thapar, bringing diverse expertise to the company.

The management team of Apollo Tyres includes the following key individuals:<BR><BR>1. **Onkar S Kanwar** - Chairman (Non-Executive)<BR>2. **Neeraj Kanwar** - Vice Chairman & Managing Director<BR>3. **Satish Sharma** - Whole-time Director<BR>4. **Robert Steinmetz** - Director<BR>5. **Sunam Sarkar** - Director<BR>6. **Francesco Gori** - Director<BR>7. **Vishal Mahadevia** - Director<BR><BR>Additionally, the board includes several independent directors:<BR>- **Vikram S Mehta**<BR>- **Akshay Chudasama**<BR>- **Pallavi Shroff**<BR>- **Bikram Singh**<BR>- **Vinod Rai**<BR>- **Francesco Crispino**<BR>- **Lakshmi Puri**<BR>- **Jaimini Bhagwati**<BR><BR>The company also has a Company Secretary and Compliance Officer, **Seema Thapar**. This diverse management team brings a wealth of experience and expertise to Apollo Tyres.

View full answer

What does Apollo Tyres do?

14-Aug-2026

Apollo Tyres Ltd. is a prominent Indian tyre manufacturer established in 1972, with a market cap of INR 28,135 Cr and reported net sales of 7,398 Cr and net profit of 349 Cr for June 2026. Key financial metrics include a P/E ratio of 12.00 and a dividend yield of 1.35%.

Overview: <BR>Apollo Tyres Ltd. is a leading tyre manufacturing company in India, operating within the Tyres & Rubber Products industry and categorized as a Small Cap company.<BR><BR>History: <BR>Apollo Tyres Ltd. was incorporated on 28 September 1972 and began production at its first manufacturing plant in Perambra, Kerala. The latest quarterly results reported net sales and net profit for June 2026.<BR><BR>Financial Snapshot: <BR>- Net Sales: 7,398 Cr (Quarterly Results - Jun 2026) <BR>- Net Profit: 349 Cr (Quarterly Results - Jun 2026) <BR>- Market Cap: INR 28,135 Cr (Small Cap) <BR><BR>Key Metrics: <BR>- P/E: 12.00 <BR>- Industry P/E: 21 <BR>- Dividend Yield: 1.35% <BR>- Debt-Equity: 0.16 <BR>- Return on Equity: 12.51% <BR>- Price to Book: 1.69 <BR><BR>Contact Details: <BR>Address: 3rd Floor Areekal Mansion, Panampilly Ngr Nr Manorama Jun Kochi Kerala : 682036 <BR>Tel: 91-484-4012046 <BR>Email: investor@apollotyres.com <BR>Website: http://www.apollotyres.com

View full answer

Who are the peers of the Apollo Tyres?

14-Aug-2026

Apollo Tyres' peers include MRF, Balkrishna Industries, CEAT, JK Tyre & Industries, TVS Srichakra, Goodyear India, Tolins Tyres, and Modi Rubber. MRF and Balkrishna Industries lead in management risk and growth, while Apollo Tyres shows below-average growth and a 1-year return of -0.35%.

Peers: The peers of Apollo Tyres are MRF, Balkrishna Inds, CEAT, JK Tyre & Indust, TVS Srichakra, Goodyear India, Megamont, Tolins Tyres, and Modi Rubber.<BR><BR>Quality Snapshot: Excellent management risk is observed at MRF and Balkrishna Inds, while Good management risk is found at Apollo Tyres, CEAT, JK Tyre & Indust, and Goodyear India. Average management risk is noted at TVS Srichakra and Tolins Tyres, while Below Average management risk is seen at Modi Rubber. Growth is rated as Excellent for MRF and Balkrishna Inds, Average for CEAT, and Below Average for Apollo Tyres, JK Tyre & Indust, TVS Srichakra, and Goodyear India, with the rest showing Below Average growth. Capital Structure is Excellent for MRF and Balkrishna Inds, Good for Apollo Tyres, Average for CEAT, and Below Average for JK Tyre & Indust and TVS Srichakra, while Tolins Tyres has Excellent capital structure and Modi Rubber has Below Average.<BR><BR>Return Snapshot: The peer with the highest 1-year return is JK Tyre & Indust at 22.25%, while the lowest is Tolins Tyres at -37.99%. Apollo Tyres has a 1-year return of -0.35%, which is better than Tolins Tyres but worse than JK Tyre & Indust. Additionally, several peers, including JK Tyre & Indust, Goodyear India, Tolins Tyres, and Modi Rubber, have negative six-month returns.

View full answer

How big is Apollo Tyres?

14-Aug-2026

As of 14th August, Apollo Tyres Ltd. has a market capitalization of 28,201.66 Cr, with net sales of 29,307.63 Cr and a net profit of 1,708.41 Cr reported in the latest four quarters.

As of 14th August, Apollo Tyres Ltd. has a market capitalization of 28,201.66 Cr, categorizing it as a Small Cap company.<BR><BR>In the latest four quarters, Apollo Tyres reported net sales of 29,307.63 Cr and a net profit of 1,708.41 Cr.<BR><BR>The latest annual period for the balance sheet is March 2026, with shareholder's funds amounting to 16,715.17 Cr and total assets of 29,033.73 Cr.

View full answer

Should I buy, sell or hold Apollo Tyres Ltd.?

08-Aug-2026

When is the next results date for Apollo Tyres Ltd.?

31-Jul-2026

The next results date for Apollo Tyres Ltd. is 06 August 2026.

The next results date for Apollo Tyres Ltd. is scheduled for 06 August 2026.

View full answer

Are Apollo Tyres Ltd. latest results good or bad?

15-May-2026

Apollo Tyres Ltd.'s latest results show a significant year-on-year net profit increase of 241.77% to ₹630.97 crores, largely due to a one-time tax credit; however, excluding this, profit before tax fell by 77.61%, and there are concerns over declining sales and margins, suggesting a cautious outlook for investors.

Apollo Tyres Ltd.'s latest results present a mixed picture. On one hand, the company reported a significant year-on-year increase in net profit for Q4 FY26, reaching ₹630.97 crores, which is a remarkable 241.77% growth compared to the same quarter last year. However, this impressive figure is somewhat misleading due to an extraordinary tax credit of ₹469.32 crores that inflated the net profit. When excluding this one-time benefit, the profit before tax actually declined sharply by 77.61% year-on-year.<BR><BR>In terms of net sales, the company achieved ₹7,335.67 crores, reflecting a 14.20% increase year-on-year, but it also experienced a sequential decline of 5.26% from the previous quarter, indicating potential demand softness. Operating margins also contracted, dropping to 14.57% from 15.32% in the previous quarter, which highlights ongoing pressures from rising input costs and competitive pricing.<BR><BR>Additionally, the return on equity (ROE) stands at a modest 9.00%, which is below industry peers, raising concerns about capital efficiency. Overall, while the headline profit growth appears strong, the underlying operational challenges and sequential declines in sales and margins suggest a cautious outlook for investors. <BR><BR>In summary, the results can be seen as good in terms of year-on-year profit growth, but the operational realities and sequential declines indicate potential issues that need to be addressed.

View full answer

Has Apollo Tyres Ltd. declared dividend?

05-Feb-2026

Yes, Apollo Tyres Ltd. has declared a dividend of 350% (₹5 per share), with an ex-date of February 10, 2026. The total returns over various periods show mixed performance, with strong returns over longer durations.

Apollo Tyres Ltd. has declared a dividend.<BR><BR>Dividend Details:<BR>- Percentage announced: 350%<BR>- Amount per share: 5<BR>- Ex-date: 10 Feb 26<BR><BR>Dividend Yield: 0.98%.<BR><BR>Total Returns by Period:<BR>In the 3-month period, the price return was -2.81%, the dividend return was 0.68%, resulting in a total return of -2.13%.<BR><BR>For the 6-month period, the price return was 15.4%, the dividend return was 0.80%, leading to a total return of 16.2%.<BR><BR>Over the 1-year period, the price return was 20.8%, the dividend return was 2.01%, culminating in a total return of 22.81%.<BR><BR>In the 2-year period, the price return was -6.92%, the dividend return was 2.74%, resulting in a total return of -4.18%.<BR><BR>For the 3-year period, the price return was 53.76%, the dividend return was 4.56%, leading to a total return of 58.32%.<BR><BR>In the 4-year period, the price return was 126.79%, the dividend return was 9.89%, culminating in a total return of 136.68%.<BR><BR>Lastly, over the 5-year period, the price return was 110.25%, the dividend return was 7.30%, resulting in a total return of 117.55%.<BR><BR>Overall, Apollo Tyres Ltd. has declared a significant dividend, and the total returns over various periods show a mix of positive and negative performance, with strong returns observed over longer durations.

View full answer

Is Apollo Tyres technically bullish or bearish?

13-Nov-2025

As of November 12, 2025, Apollo Tyres shows a strong bullish trend supported by positive MACD and Bollinger Bands, despite some short-term weakness indicated by the weekly RSI.

As of 12 November 2025, the technical trend has changed from mildly bullish to bullish. The current stance is bullish with strong indicators supporting this view. The MACD is bullish on both weekly and monthly time frames, while Bollinger Bands also reflect a bullish trend in both time frames. The daily moving averages are bullish, further confirming the positive momentum. However, the weekly RSI is bearish, which suggests some short-term weakness. The KST is bullish on a weekly basis but mildly bearish monthly, indicating mixed signals. Dow Theory shows a mildly bullish stance in both weekly and monthly assessments. Overall, the bullish indicators outweigh the bearish ones, suggesting a strong bullish sentiment in the market for Apollo Tyres.

View full answer

How has been the historical performance of Apollo Tyres?

13-Nov-2025

Apollo Tyres has experienced steady growth in net sales, increasing from 16,350.19 Cr in March 2020 to 26,123.42 Cr in March 2025, but profitability metrics have declined, with profit after tax dropping to 1,120.65 Cr in March 2025 from 1,721.51 Cr in March 2024. Overall, while sales have risen, challenges in margins and net profit persist.

Answer:<BR>The historical performance of Apollo Tyres shows a steady increase in net sales and profit over the years, with some fluctuations in expenses and margins.<BR><BR>Breakdown:<BR>Apollo Tyres has demonstrated a consistent growth in net sales, rising from 16,350.19 Cr in March 2020 to 26,123.42 Cr in March 2025. Total operating income followed a similar trend, reaching 26,123.42 Cr in March 2025, up from 17,548.84 Cr in March 2019. However, total expenditure, excluding depreciation, also increased, amounting to 22,551.89 Cr in March 2025, which impacted the operating profit (PBDIT) that stood at 3,571.53 Cr for the same period, down from 4,447.35 Cr in March 2024. The profit before tax saw a decline to 1,545.97 Cr in March 2025 from 2,539.84 Cr in March 2024, while profit after tax was reported at 1,120.65 Cr in March 2025, down from 1,721.51 Cr in March 2024. The earnings per share (EPS) decreased to 17.66 in March 2025 from 27.11 in March 2024. On the balance sheet, total liabilities increased to 27,226.69 Cr in March 2025, while total assets slightly decreased to 27,226.69 Cr from 27,281.12 Cr in March 2023. Cash flow from operating activities dropped to 1,823.00 Cr in March 2025 from 3,439.00 Cr in March 2024, reflecting a challenging cash flow environment. Overall, while Apollo Tyres has shown growth in sales and assets, profitability metrics indicate some challenges in maintaining margins and net profit levels.

View full answer

Who are the top shareholders of the Apollo Tyres?

17-Jul-2025

The top shareholders of Apollo Tyres include promoters, with Sunrays Properties & Investment Co. Pvt. Ltd. holding 31.85%, and institutional investors, including mutual funds at 18.12% and foreign institutional investors at 13.43%. The highest public shareholder is Emerald Sage Investment Ltd at 9.93%, while individual investors hold 6.94%.

The top shareholders of Apollo Tyres include a mix of promoters, institutional investors, and individual shareholders. The majority of the shares are held by promoters, with Sunrays Properties & Investment Co. Pvt. Ltd. being the largest promoter, holding 31.85%. <BR><BR>In terms of institutional holdings, mutual funds collectively hold 18.12% through 43 schemes, while foreign institutional investors (FIIs) own 13.43% across 180 entities. The highest public shareholder is Emerald Sage Investment Ltd, which holds 9.93%. Individual investors account for 6.94% of the holdings. <BR><BR>Overall, the ownership structure reflects a strong presence of promoter and institutional investment in the company.

View full answer

Is Apollo Tyres overvalued or undervalued?

09-Jun-2025

As of May 15, 2024, Apollo Tyres is considered fairly valued with a PE ratio of 24.09, an EV to EBITDA of 9.36, and a ROCE of 11.34%, showing a shift from very attractive to attractive, while underperforming against the Sensex with a year-to-date return of -11.21%.

As of 15 May 2024, Apollo Tyres' valuation grade has moved from very attractive to attractive, indicating a slight shift in its perceived value. The company is currently considered fairly valued. Key ratios include a PE ratio of 24.09, an EV to EBITDA of 9.36, and a ROCE of 11.34%. <BR><BR>In comparison to its peers, Apollo Tyres' PE ratio is lower than MRF's 31.76 and Balkrishna Industries' 29.20, while it is on par with CEAT's 31.21. The company's dividend yield stands at 1.27%, which is competitive within the industry. Notably, Apollo Tyres has underperformed against the Sensex in the short term, with a year-to-date return of -11.21% compared to the Sensex's 5.59%.

View full answer
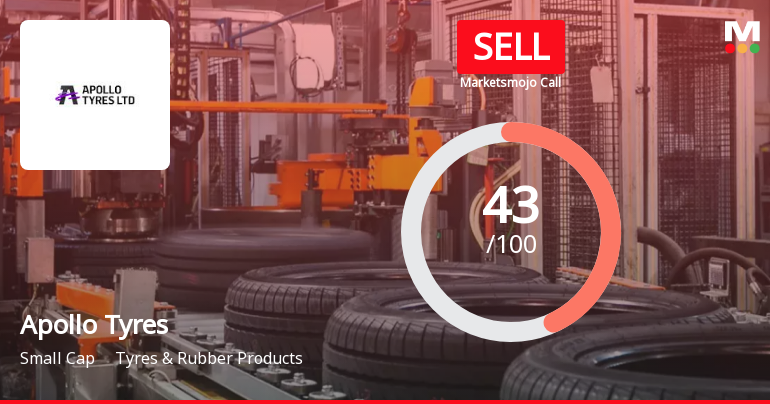
iScoreScore
Click here to find our call on this stock
Strong Sell
Sell
Hold
Buy
Strong Buy

Dashboard

1

Poor long term growth as Operating profit has grown by an annual rate 8.52% of over the last 5 years

 
stock-summaryMojo Parameters

Mojo Parameters

Loading Valuation Snapshot...

Stock DNA

stock-summary
Industry

Tyres & Rubber Products

stock-summary
Market cap

INR 28,008 Cr (Small Cap)

stock-summary
P/E

12.00

stock-summary
Industry P/E

21

stock-summary
Dividend Yield

1.35%

stock-summary
Debt Equity

0.16

stock-summary
Return on Equity

12.51%

stock-summary
Price to Book

1.68

Revenue and Profits:
Net Sales:
7,398 Cr
(Quarterly Results - Jun 2026)
Net Profit:
349 Cr
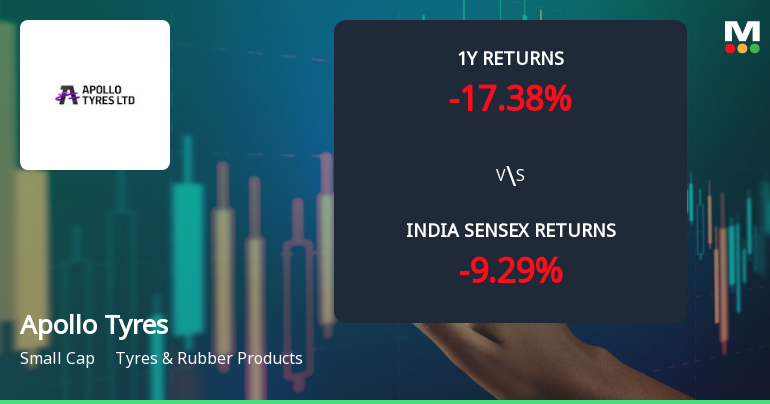
stock-summaryTotal Returns
Total Returns (Price + Dividend) stock-summary
Dividend Yield (1.35%)
TimePeriod
Price Return
Dividend Return
Total Return
3 Months
10.53%
0.67%
11.2%
6 Months
-9.3%
0.52%
-8.78%
1 Year
2.6%
1.28%
3.88%
2 Years
-8.75%
2.19%
-6.56%
3 Years
11.08%
4.38%
15.46%
4 Years
88.18%
6.88%
95.06%
5 Years
97.07%
9.65%
106.72%

Latest dividend: 2.5 per share ex-dividend date: Jul-10-2026

Risk Adjusted Returns v/s stock-summary
Returns Beta
Icon
Beta has not been calculated since enough price history is not available
stock-summaryNews & Corporate Actions

News

Apollo Tyres Declines 0.30%: Mixed Fundamentals and Earnings Pressure Shape Week

Announcements stock-summary

Board Meeting Outcome for Outcome Of Board Meeting

13-Aug-2026 | Source : BSE

Please find enclosed outcome of Board Meeting

Announcement under Regulation 30 (LODR)-Change in Management

13-Aug-2026 | Source : BSE

Please find enclosed intimation regarding appointment of Whole-time Director

Announcement under Regulation 30 (LODR)-Change in Directorate

13-Aug-2026 | Source : BSE

Please find enclosed intimation regarding appointment of Whole-time Director.

Corporate Actions stock-summary

stock-summary
BOARD MEETING

No Upcoming Board Meetings

stock-summary
DIVIDEND

Apollo Tyres Ltd. has declared 250% dividend, ex-date: 10 Jul 26

stock-summary
SPLITS

Apollo Tyres Ltd. has announced 1:10 stock split, ex-date: 17 Aug 07

stock-summary
BONUS

No Bonus history available

stock-summary
RIGHTS

No Rights history available

stock-summaryKey Factors

Quality key factors stock-summary

Factor
Value
Sales Growth (5y)
9.00%
EBIT Growth (5y)
8.52%
EBIT to Interest (avg)
4.83
Debt to EBITDA (avg)
1.67
Net Debt to Equity (avg)
0.16
Sales to Capital Employed (avg)
1.25
Tax Ratio
1.73%
Dividend Payout Ratio
28.32%
Pledged Shares
0.01%
Institutional Holding
40.70%
ROCE (avg)
11.77%
ROE (avg)
9.51%

Valuation key factors

Factor
Value
P/E Ratio
12
Industry P/E
21
Price to Book Value
1.69
EV to EBIT
11.92
EV to EBITDA
7.44
EV to Capital Employed
1.59
EV to Sales
1.05
PEG Ratio
0.10
Dividend Yield
1.35%
ROCE (Latest)
13.44%
ROE (Latest)
12.51%

Technicals key factors

Indicator
Weekly
Monthly
MACD
Mildly Bullish
Bearish
RSI
No Signal
No Signal
Bollinger Bands
Mildly Bullish
Mildly Bearish
Moving Averages
Mildly Bearish (Daily)
KST
Bullish
Bearish
Dow Theory
No Trend
No Trend
OBV
No Trend
Mildly Bullish
stock-summary Technical Indicator Scale: Bearish, Mildly Bearish, Sideways, Mildly Bullish, Bullish  Turned 
stock-summaryShareholding
Shareholding Snapshot : Jun 2026stock-summary
Shareholding Compare (%holding) stock-summary
Majority shareholders

Promoters

Pledged Promoter Holdings

0.0102

Mutual Funds

Held by 45 Schemes (18.28%)

FIIs

Held by 224 FIIs (10.08%)

Promoter with highest holding

Sunrays Properties And Investment Co. Pvt. Ltd. (31.85%)

Highest Public shareholder

Emerald Sage Investment Ltd (9.93%)

Individual Investors Holdings

7.64%

stock-summaryFinancial
[
  {
    "link": "quarterly",
    "btn_text": "All Quarterly Results",
    "header": "Quarterly Results Snapshot (Consolidated) - Jun'26 - QoQ",
    "rhs": [
      {
        "prefix": "Net Sales ",
        "suffix": "QoQ Growth in quarter ended Jun 2026 is 0.85% vs -5.26% in Mar 2026",
        "dir": 1
      },
      {
        "prefix": "Consolidated Net Profit ",
        "suffix": "QoQ Growth in quarter ended Jun 2026 is -44.71% vs 34.10% in Mar 2026",
        "dir": -1
      }
    ],
    "table": {
      "header": [
        "Jun'26",
        "Mar'26",
        "Change(%)"
      ],
      "body": [
        {
          "field": "Net Sales",
          "val1": "7,397.79",
          "val2": "7,335.67",
          "chgp": "0.85%",
          "chgp_class": "positive"
        },
        {
          "field": "Operating Profit (PBDIT) excl Other Income",
          "val1": "867.97",
          "val2": "1,068.80",
          "chgp": "-18.79%",
          "chgp_class": "negative"
        },
        {
          "field": "Interest",
          "val1": "91.47",
          "val2": "89.77",
          "chgp": "1.89%",
          "chgp_class": "negative"
        },
        {
          "field": "Exceptional Items",
          "val1": "23.54",
          "val2": "-456.13",
          "chgp": "105.16%",
          "chgp_class": "positive"
        },
        {
          "field": "Consolidate Net Profit",
          "val1": "348.87",
          "val2": "630.97",
          "chgp": "-44.71%",
          "chgp_class": "negative"
        },
        {
          "field": "Operating Profit Margin (Excl OI)",
          "val1": "11.73%",
          "val2": "14.57%",
          "chgp": "-2.84%",
          "chgp_class": "negative"
        }
      ]
    }
  },
  {
    "link": "half-yearly",
    "btn_text": "All Half Yearly Results",
    "header": "Half Yearly Results Snapshot (Consolidated) - Sep'25",
    "rhs": [
      {
        "prefix": "Net Sales ",
        "suffix": " Growth in half year ended Sep 2025 is 4.85% vs 1.98% in Sep 2024",
        "dir": 1
      },
      {
        "prefix": "Consolidated Net Profit ",
        "suffix": " Growth in half year ended Sep 2025 is -54.80% vs -31.19% in Sep 2024",
        "dir": -1
      }
    ],
    "table": {
      "header": [
        "Sep'25",
        "Sep'24",
        "Change(%)"
      ],
      "body": [
        {
          "field": "Net Sales",
          "val1": "13,391.85",
          "val2": "12,771.88",
          "chgp": "4.85%",
          "chgp_class": "positive"
        },
        {
          "field": "Operating Profit (PBDIT) excl Other Income",
          "val1": "1,888.50",
          "val2": "1,787.15",
          "chgp": "5.67%",
          "chgp_class": "positive"
        },
        {
          "field": "Interest",
          "val1": "201.63",
          "val2": "226.70",
          "chgp": "-11.06%",
          "chgp_class": "positive"
        },
        {
          "field": "Exceptional Items",
          "val1": "-550.24",
          "val2": "-45.59",
          "chgp": "-1,106.93%",
          "chgp_class": "negative"
        },
        {
          "field": "Consolidate Net Profit",
          "val1": "270.93",
          "val2": "599.46",
          "chgp": "-54.80%",
          "chgp_class": "negative"
        },
        {
          "field": "Operating Profit Margin (Excl OI)",
          "val1": "14.10%",
          "val2": "13.99%",
          "chgp": "0.11%",
          "chgp_class": "positive"
        }
      ]
    }
  },
  {
    "link": "nine-monthly",
    "btn_text": "All Nine Monthly Results",
    "header": "Nine Monthly Results Snapshot (Consolidated) - Dec'25",
    "rhs": [
      {
        "prefix": "Net Sales ",
        "suffix": "YoY Growth in nine months ended Dec 2025 is 7.28% vs 3.04% in Dec 2024",
        "dir": 1
      },
      {
        "prefix": "Consolidated Net Profit ",
        "suffix": "YoY Growth in nine months ended Dec 2025 is -20.85% vs -31.52% in Dec 2024",
        "dir": 1
      }
    ],
    "table": {
      "header": [
        "Dec'25",
        "Dec'24",
        "Change(%)"
      ],
      "body": [
        {
          "field": "Net Sales",
          "val1": "21,134.93",
          "val2": "19,699.83",
          "chgp": "7.28%",
          "chgp_class": "positive"
        },
        {
          "field": "Operating Profit (PBDIT) excl Other Income",
          "val1": "3,074.44",
          "val2": "2,734.16",
          "chgp": "12.45%",
          "chgp_class": "positive"
        },
        {
          "field": "Interest",
          "val1": "301.72",
          "val2": "337.22",
          "chgp": "-10.53%",
          "chgp_class": "positive"
        },
        {
          "field": "Exceptional Items",
          "val1": "-577.38",
          "val2": "-49.83",
          "chgp": "-1,058.70%",
          "chgp_class": "negative"
        },
        {
          "field": "Consolidate Net Profit",
          "val1": "741.45",
          "val2": "936.71",
          "chgp": "-20.85%",
          "chgp_class": "negative"
        },
        {
          "field": "Operating Profit Margin (Excl OI)",
          "val1": "14.55%",
          "val2": "13.88%",
          "chgp": "0.67%",
          "chgp_class": "positive"
        }
      ]
    }
  },
  {
    "link": "annual",
    "btn_text": "All Annual Results",
    "header": "Annual Results Snapshot (Consolidated) - Mar'26",
    "rhs": [
      {
        "prefix": "Net Sales ",
        "suffix": "YoY Growth in year ended Mar 2026 is 8.98% vs 2.94% in Mar 2025",
        "dir": 1
      },
      {
        "prefix": "Consolidated Net Profit ",
        "suffix": "YoY Growth in year ended Mar 2026 is 22.39% vs -34.88% in Mar 2025",
        "dir": 1
      }
    ],
    "table": {
      "header": [
        "Mar'26",
        "Mar'25",
        "Change(%)"
      ],
      "body": [
        {
          "field": "Net Sales",
          "val1": "28,470.60",
          "val2": "26,123.42",
          "chgp": "8.98%",
          "chgp_class": "positive"
        },
        {
          "field": "Operating Profit (PBDIT) excl Other Income",
          "val1": "4,143.24",
          "val2": "3,571.53",
          "chgp": "16.01%",
          "chgp_class": "positive"
        },
        {
          "field": "Interest",
          "val1": "391.50",
          "val2": "446.62",
          "chgp": "-12.34%",
          "chgp_class": "positive"
        },
        {
          "field": "Exceptional Items",
          "val1": "-1,033.51",
          "val2": "-168.67",
          "chgp": "-512.74%",
          "chgp_class": "negative"
        },
        {
          "field": "Consolidate Net Profit",
          "val1": "1,372.42",
          "val2": "1,121.32",
          "chgp": "22.39%",
          "chgp_class": "positive"
        },
        {
          "field": "Operating Profit Margin (Excl OI)",
          "val1": "14.55%",
          "val2": "13.67%",
          "chgp": "0.88%",
          "chgp_class": "positive"
        }
      ]
    }
  }
]

Quarterly Results Snapshot (Consolidated) - Jun'26 - QoQstock-summary

Jun'26
Mar'26
Change(%)
Net Sales
7,397.79
7,335.67
0.85%
Operating Profit (PBDIT) excl Other Income
867.97
1,068.80
-18.79%
Interest
91.47
89.77
1.89%
Exceptional Items
23.54
-456.13
105.16%
Consolidate Net Profit
348.87
630.97
-44.71%
Operating Profit Margin (Excl OI)
11.73%
14.57%
-2.84%
Values in Rs Cr.
Direction Arrows
Net Sales

QoQ Growth in quarter ended Jun 2026 is 0.85% vs -5.26% in Mar 2026

Direction Arrows
Consolidated Net Profit

QoQ Growth in quarter ended Jun 2026 is -44.71% vs 34.10% in Mar 2026

Half Yearly Results Snapshot (Consolidated) - Sep'25stock-summary

Sep'25
Sep'24
Change(%)
Net Sales
13,391.85
12,771.88
4.85%
Operating Profit (PBDIT) excl Other Income
1,888.50
1,787.15
5.67%
Interest
201.63
226.70
-11.06%
Exceptional Items
-550.24
-45.59
-1,106.93%
Consolidate Net Profit
270.93
599.46
-54.80%
Operating Profit Margin (Excl OI)
14.10%
13.99%
0.11%
Values in Rs Cr.
Direction Arrows
Net Sales

Growth in half year ended Sep 2025 is 4.85% vs 1.98% in Sep 2024

Direction Arrows
Consolidated Net Profit

Growth in half year ended Sep 2025 is -54.80% vs -31.19% in Sep 2024

Nine Monthly Results Snapshot (Consolidated) - Dec'25stock-summary

Dec'25
Dec'24
Change(%)
Net Sales
21,134.93
19,699.83
7.28%
Operating Profit (PBDIT) excl Other Income
3,074.44
2,734.16
12.45%
Interest
301.72
337.22
-10.53%
Exceptional Items
-577.38
-49.83
-1,058.70%
Consolidate Net Profit
741.45
936.71
-20.85%
Operating Profit Margin (Excl OI)
14.55%
13.88%
0.67%
Values in Rs Cr.
Direction Arrows
Net Sales

YoY Growth in nine months ended Dec 2025 is 7.28% vs 3.04% in Dec 2024

Direction Arrows
Consolidated Net Profit

YoY Growth in nine months ended Dec 2025 is -20.85% vs -31.52% in Dec 2024

Annual Results Snapshot (Consolidated) - Mar'26stock-summary

Mar'26
Mar'25
Change(%)
Net Sales
28,470.60
26,123.42
8.98%
Operating Profit (PBDIT) excl Other Income
4,143.24
3,571.53
16.01%
Interest
391.50
446.62
-12.34%
Exceptional Items
-1,033.51
-168.67
-512.74%
Consolidate Net Profit
1,372.42
1,121.32
22.39%
Operating Profit Margin (Excl OI)
14.55%
13.67%
0.88%
Values in Rs Cr.
Direction Arrows
Net Sales

YoY Growth in year ended Mar 2026 is 8.98% vs 2.94% in Mar 2025

Direction Arrows
Consolidated Net Profit

YoY Growth in year ended Mar 2026 is 22.39% vs -34.88% in Mar 2025

stock-summaryCompany CV
About Apollo Tyres Ltd. stock-summary
stock-summary
Apollo Tyres Ltd.
Small Cap
Tyres & Rubber Products
Apollo Tyres Limited is the leading tyre manufacturing company in India, which was incorporated on 28 September, 1972 and started production with its first manufacturing plant in at Perambra in Kerala. At present, Company is engaged in manufacturing and sale of automobile tyres and tubes.
Company Coordinates stock-summary
Company Details
3rd Floor Areekal Mansion, Panampilly Ngr Nr Manorama Jun Kochi Kerala : 682036
stock-summary
Tel: 91-484-4012046
stock-summary
investor@apollotyres.com
Registrar Details
Apollo Tyres Ltd., 6th Floor Cherupushpam Building, Shanmugham Road , Kochi