
Compare CEAT with Similar Stocks
Stock DNA
Tyres & Rubber Products
INR 14,319 Cr (Small Cap)
21.00
20
0.85%
0.64
14.80%
2.85
Total Returns (Price + Dividend) 
Latest dividend: 30 per share ex-dividend date: Aug-08-2025
Risk Adjusted Returns v/s
Returns Beta

News

CEAT Ltd Downgraded to Sell Amid Financial and Technical Setbacks
CEAT Ltd, a prominent player in the Tyres & Rubber Products sector, has seen its investment rating downgraded from Hold to Sell as of 17 July 2026. This shift reflects a comprehensive reassessment across four critical parameters: Quality, Valuation, Financial Trend, and Technicals. The downgrade follows a challenging quarter marked by deteriorating financial metrics, subdued technical signals, and a recalibration of valuation attractiveness.
Read full news article
CEAT Ltd Shares Slide Amid Mixed Technical Signals and Downgrade to Sell
CEAT Ltd, a key player in the Tyres & Rubber Products sector, witnessed a sharp decline of 7.29% on 20 Jul 2026, closing at ₹3,550.10. This drop follows a recent downgrade from Hold to Sell by MarketsMOJO, reflecting a shift in technical momentum and a cautious outlook amid mixed indicator signals.
Read full news article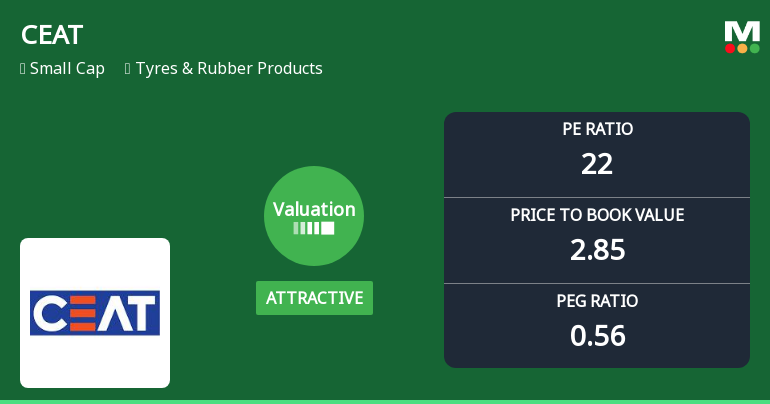
CEAT Ltd Valuation Shifts to Attractive Amid Market Volatility
CEAT Ltd, a key player in the Tyres & Rubber Products sector, has witnessed a notable shift in its valuation parameters, moving from a very attractive to an attractive price level. Despite a recent sharp decline in share price, the company’s valuation metrics suggest a more compelling investment case relative to its historical averages and peer group, even as its overall market sentiment remains cautious.
Read full news article Announcements
CEAT Limited - Updates
28-Nov-2019 | Source : NSECEAT Limited has informed the Exchange regarding 'Pursuant to Regulation 30 read with Schedule III of the SEBI (Listing Obligations and Disclosure Requirements) Regulations, 2015 and the Company s Policy on Determination of Materiality of Events, and in furtherance to the disclosure made by the Company on May 31, 2019, we hereby inform you that the Company has now signed the Share Subscription and Shareholders Agreement ( SSHA ) with Greenzest Solar Private Limited (Greenzest) and Cleantech India OA Pte. Ltd. (Cleantech), for subscribing to at least 26% of total equity share capital of Greenzest, for a value note exceeding Rs. 5 Crores.'.
CEAT Limited - Other General Purpose
21-Nov-2019 | Source : NSECEAT Limited has informed the Exchange that Pursuant to Regulation 23(9) of SEBI (Listing Obligations and Disclosure Requirements) Regulations, 2015, please find enclosed the disclosure of related party transactions, on a consolidated basis, for the half year ended September 30, 2019.
CEAT Limited - Investor Presentation
23-Oct-2019 | Source : NSECEAT Limited has informed the Exchange regarding Investor Presentation
Corporate Actions

No Upcoming Board Meetings

CEAT Ltd has declared 300% dividend, ex-date: 08 Aug 25

No Splits history available

No Bonus history available

No Rights history available
Quality key factors
Valuation key factors
Technicals key factors
 Technical Indicator Scale: Bearish, Mildly Bearish, Sideways, Mildly Bullish, Bullish Turned
 Shareholding Snapshot : Mar 2026
Shareholding Compare (%holding)
Promoters
None
Held by 30 Schemes (17.65%)
Held by 205 FIIs (16.55%)
Instant Holdings Limited (29.51%)
Mirae Asset Nifty Total Market Index Fund (9.94%)
12.23%
Quarterly Results Snapshot (Consolidated) - Jun'26 - QoQ

QoQ Growth in quarter ended Jun 2026 is 2.35% vs 1.49% in Mar 2026

QoQ Growth in quarter ended Jun 2026 is -98.36% vs 56.64% in Mar 2026
Half Yearly Results Snapshot (Consolidated) - Sep'25
Growth in half year ended Sep 2025 is 12.39% vs 8.50% in Sep 2024
Growth in half year ended Sep 2025 is 8.10% vs -21.72% in Sep 2024
Nine Monthly Results Snapshot (Consolidated) - Dec'25
YoY Growth in nine months ended Dec 2025 is 16.96% vs 9.45% in Dec 2024
YoY Growth in nine months ended Dec 2025 is 21.71% vs -30.13% in Dec 2024
Annual Results Snapshot (Consolidated) - Mar'26
YoY Growth in year ended Mar 2026 is 18.61% vs 10.67% in Mar 2025
YoY Growth in year ended Mar 2026 is 47.68% vs -26.45% in Mar 2025
About CEAT Ltd

Company Coordinates


