
Compare DIC India with Similar Stocks
Dashboard
The company is Net-Debt Free
Poor long term growth as Net Sales has grown by an annual rate of 8.67% over the last 5 years
Flat results in Mar 26
With ROE of 4.8, it has a Fair valuation with a 1.1 Price to Book Value
Majority shareholders : Promoters
Below par performance in long term as well as near term
Stock DNA
Other Chemical products
INR 472 Cr (Micro Cap)
23.00
43
0.60%
-0.15
4.84%
1.08
Total Returns (Price + Dividend) 
Latest dividend: 3.013469387755102 per share ex-dividend date: Mar-16-2026
Risk Adjusted Returns v/s
Returns Beta

News

DIC India Ltd is Rated Hold by MarketsMOJO
DIC India Ltd is rated 'Hold' by MarketsMOJO, with this rating last updated on 19 June 2026. While the rating change occurred on that date, the analysis and financial metrics discussed here reflect the stock's current position as of 21 June 2026, providing investors with an up-to-date view of the company’s fundamentals, returns, and market standing.
Read full news article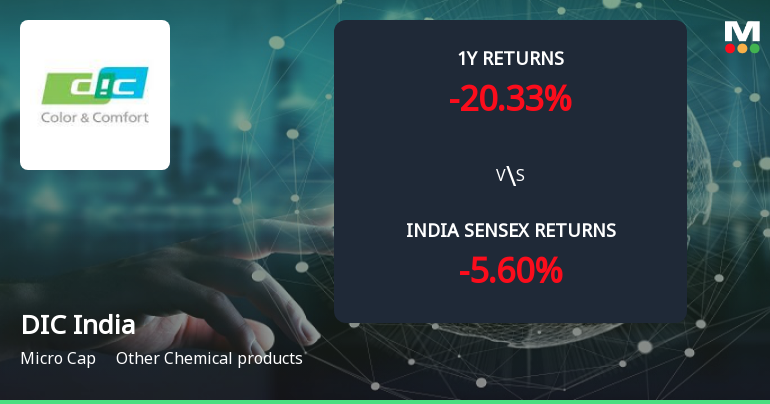
DIC India Ltd Forms Golden Cross Amid Mixed Technical Signals and Micro-Cap Challenges
The 50-day moving average for DIC India Ltd has crossed above the 200-day moving average, creating a golden cross on 19 Jun 2026. Yet, this technical milestone arrives amid a complex backdrop: weekly and monthly momentum indicators remain bearish, and the stock’s micro-cap status raises questions about signal reliability.
Read full news article
DIC India Ltd is Rated Sell by MarketsMOJO
DIC India Ltd is rated 'Sell' by MarketsMOJO, with this rating last updated on 27 May 2025. However, the analysis and financial metrics discussed here reflect the stock's current position as of 10 June 2026, providing investors with an up-to-date perspective on the company’s fundamentals, valuation, financial trends, and technical outlook.
Read full news article Announcements
Filing Of Claim Against Attharv Sai Flexipack Private Limited With Interim Resolution Professional
18-Jun-2026 | Source : BSEFiling of claim against Attharv Sai FlexiPack Private Limited with Interim Resolution Professional.
Announcement under Regulation 30 (LODR)-Newspaper Publication
11-Jun-2026 | Source : BSEPlease find enclosed copies of newspaper advertisement published in Business Standard and Aajkal (Regional Language) regarding opening of special window for physical shareholders to submit relodgment requests for transfer of shares.
Board Meeting Outcome for Outcome Of Board Meeting Held On June 02 2026
02-Jun-2026 | Source : BSEPursuant to Regulation 30 read with Para A of Part A of SEBI (LODR) please find enclosed outcome of Board Meeting held on June 02 2026 to consider the resignation tendered by MD & CEO.
Corporate Actions

No Upcoming Board Meetings

DIC India Ltd has declared 30% dividend, ex-date: 16 Mar 26

No Splits history available

No Bonus history available

DIC India Ltd has announced 1:3 rights issue, ex-date: 19 Oct 07
Quality key factors
Valuation key factors
Technicals key factors
 Technical Indicator Scale: Bearish, Mildly Bearish, Sideways, Mildly Bullish, Bullish Turned
 Shareholding Snapshot : Mar 2026
Shareholding Compare (%holding)
Promoters
None
Held by 0 Schemes
Held by 0 FIIs
Dic Asia Pacific Pte Ltd (71.75%)
Hitesh Ramji Javeri (3.57%)
23.59%
Quarterly Results Snapshot (Standalone) - Mar'26 - QoQ

QoQ Growth in quarter ended Mar 2026 is 3.76% vs 3.98% in Dec 2025

QoQ Growth in quarter ended Mar 2026 is -7.02% vs -22.32% in Dec 2025
Half Yearly Results Snapshot (Standalone) - Jun'25
Growth in half year ended Jun 2025 is -0.92% vs 8.21% in Jun 2024
Growth in half year ended Jun 2025 is -33.24% vs 727.11% in Jun 2024
Nine Monthly Results Snapshot (Standalone) - Sep'25
YoY Growth in nine months ended Sep 2025 is -0.27% vs 6.02% in Sep 2024
YoY Growth in nine months ended Sep 2025 is 3.47% vs 179.99% in Sep 2024
Annual Results Snapshot (Standalone) - Dec'25
YoY Growth in year ended Dec 2025 is 1.24% vs 6.26% in Dec 2024
YoY Growth in year ended Dec 2025 is -11.05% vs 186.16% in Dec 2024
About DIC India Ltd

Company Coordinates


