
Compare DIC India with Similar Stocks
Stock DNA
Other Chemical products
INR Cr (Micro Cap)
23.00
18
0.00%
0.00
0.00%
0.00
Total Returns (Price + Dividend) 
Latest dividend: 3.013469387755102 per share ex-dividend date: Mar-16-2026
Risk Adjusted Returns v/s
Returns Beta

News

DIC India Ltd is Rated Sell by MarketsMOJO
DIC India Ltd is rated 'Sell' by MarketsMOJO, with this rating last updated on 08 July 2026. While the rating change occurred on that date, the analysis and financial metrics discussed here reflect the stock's current position as of 31 July 2026, providing investors with the latest insights into the company’s performance and outlook.
Read full news article
DIC India Ltd is Rated Sell by MarketsMOJO
DIC India Ltd is rated Sell by MarketsMOJO, with this rating last updated on 08 July 2026. While the rating change occurred on that date, the analysis and financial metrics discussed here reflect the stock's current position as of 20 July 2026, providing investors with an up-to-date view of the company’s fundamentals, returns, and market performance.
Read full news article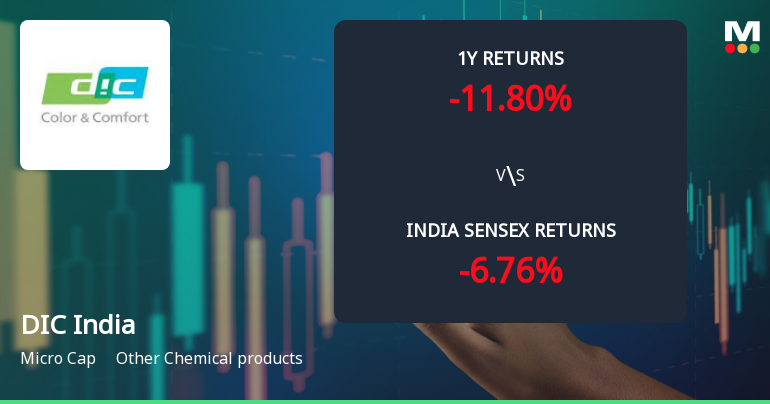
DIC India Ltd Technical Momentum Shifts Amid Mixed Indicator Signals
DIC India Ltd has experienced a notable shift in its technical momentum, with recent price action and indicator signals revealing a complex picture. Despite a strong day change of 7.18%, the stock’s technical parameters present a blend of bullish and bearish cues, prompting a reassessment of its near-term outlook within the Other Chemical products sector.
Read full news article Announcements
Board Meeting Outcome for Outcome Of The Board Meeting Held On July 15 2026
15-Jul-2026 | Source : BSEPursuant to Regulation 30 please be informed that the Board of Directors in its meeting held today had considered and approved the following: 1. To designate Mr. Hayato Kashiwagi as Managing Director of the Company. 2. Appointment of Mr. Praveen Kumar Asthana as an Additional Director of the Company in capacity of Whole Time Director in the category of Executive Director 3. Approval of upcoming postal ballot. 4. To designate Ms. Meghna Saini- Company Secretary (Compliance Officer) as Company Secretary(Compliance Officer) & Head Legal.
Announcement under Regulation 30 (LODR)-Change in Management
15-Jul-2026 | Source : BSEThe Board in its meeting held today had approved the following: 1. To designate Mr. Hayato Kashiwagi as Managing Director of the Company in the category of Executive Director. 2. Appointment of Mr. Praveen Kumar Asthana as Additional Director in the category of whole time executive Director. 3. Approval of postal ballot. 4. To designate Ms. Meghna Saini as Company Secretary(Compliance Officer) & Head Legal
Disclosure Under Regulation 30 Of SEBI (Listing Obligations And Disclosure Requirements) Regulations 2015 - Receipt Of Order Under Uttar Pradesh Goods And Services Tax Act 2017.
14-Jul-2026 | Source : BSEPlease be informed that pursuant to the appeal preferred by the Company Additional Commissioner (Appeal) Noida has passed an order in favour of the Company setting aside the demand order issued by Assistant Commissioner (in situ) CGST Range-23 Division- V Noida
Corporate Actions

No Upcoming Board Meetings

DIC India Ltd has declared 30% dividend, ex-date: 16 Mar 26

No Splits history available

No Bonus history available

DIC India Ltd has announced 1:3 rights issue, ex-date: 19 Oct 07
Quality key factors
Valuation key factors
Technicals key factors
 Technical Indicator Scale: Bearish, Mildly Bearish, Sideways, Mildly Bullish, Bullish Turned
 Shareholding Snapshot : Jun 2026
Shareholding Compare (%holding)
Promoters
None
Held by 0 Schemes
Held by 0 FIIs
Dic Asia Pacific Pte Ltd (71.75%)
Hitesh Ramji Javeri (4.6%)
23.35%
Quarterly Results Snapshot (Standalone) - Mar'26 - QoQ

QoQ Growth in quarter ended Mar 2026 is 3.76% vs 3.98% in Dec 2025

QoQ Growth in quarter ended Mar 2026 is -7.02% vs -22.32% in Dec 2025
Half Yearly Results Snapshot (Standalone) - Jun'25
Growth in half year ended Jun 2025 is -0.92% vs 8.21% in Jun 2024
Growth in half year ended Jun 2025 is -33.24% vs 727.11% in Jun 2024
Nine Monthly Results Snapshot (Standalone) - Sep'25
YoY Growth in nine months ended Sep 2025 is -0.27% vs 6.02% in Sep 2024
YoY Growth in nine months ended Sep 2025 is 3.47% vs 179.99% in Sep 2024
Annual Results Snapshot (Standalone) - Dec'25
YoY Growth in year ended Dec 2025 is 1.24% vs 6.26% in Dec 2024
YoY Growth in year ended Dec 2025 is -11.05% vs 186.16% in Dec 2024
About DIC India Ltd

Company Coordinates


