
Compare Gujarat Hotels with Similar Stocks
Total Returns (Price + Dividend) 
Latest dividend: 2.964673913043478 per share ex-dividend date: Aug-08-2025
Risk Adjusted Returns v/s
Returns Beta

News

Gujarat Hotels Ltd. is Rated Strong Sell
Gujarat Hotels Ltd. is rated Strong Sell by MarketsMOJO, with this rating last updated on 13 January 2026. However, the analysis and financial metrics discussed here reflect the company’s current position as of 17 June 2026, providing investors with the latest insights into the stock’s fundamentals, valuation, financial trends, and technical outlook.
Read full news article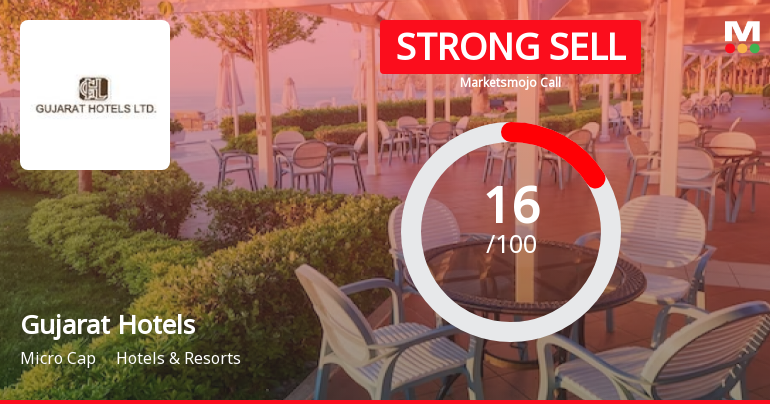
Gujarat Hotels Ltd. is Rated Strong Sell
Gujarat Hotels Ltd. is rated Strong Sell by MarketsMOJO, with this rating last updated on 13 Jan 2026. However, the analysis and financial metrics discussed here reflect the stock’s current position as of 26 May 2026, providing investors with an up-to-date perspective on the company’s performance and outlook.
Read full news article
Gujarat Hotels Ltd. is Rated Strong Sell
Gujarat Hotels Ltd. is rated Strong Sell by MarketsMOJO. This rating was last updated on 13 Jan 2026, reflecting a reassessment of the stock’s outlook. However, all fundamentals, returns, and financial metrics discussed here are current as of 15 May 2026, providing investors with the latest perspective on the company’s position.
Read full news article Announcements
Announcement under Regulation 30 (LODR)-Newspaper Publication
30-May-2026 | Source : BSEPublication of Notice regarding Special Window for transfer and dematerialisation of physical shares.
Compliances-Reg.24(A)-Annual Secretarial Compliance
22-May-2026 | Source : BSEAnnual Secretarial Compliance Report
Financial Results For The Financial Year Ended 31St March 2026
23-Apr-2026 | Source : BSEFinancial Results for Financial year ended 31st March 2026
Corporate Actions

No Upcoming Board Meetings

Gujarat Hotels Ltd. has declared 30% dividend, ex-date: 08 Aug 25

No Splits history available

No Bonus history available

No Rights history available
Quality key factors
Valuation key factors
Technicals key factors
 Technical Indicator Scale: Bearish, Mildly Bearish, Sideways, Mildly Bullish, Bullish Turned
 Shareholding Snapshot : Mar 2026
Shareholding Compare (%holding)
Promoters
None
Held by 0 Schemes
Held by 0 FIIs
Itc Hotels Limited (45.78%)
Viren Shantilal Shah (5.76%)
33.39%
Quarterly Results Snapshot (Standalone) - Mar'26 - QoQ

QoQ Growth in quarter ended Mar 2026 is 26.56% vs 39.13% in Dec 2025
QoQ Growth in quarter ended Mar 2026 is 5.37% vs 25.21% in Dec 2025
Half Yearly Results Snapshot (Standalone) - Sep'25

Growth in half year ended Sep 2025 is 24.64% vs 5.34% in Sep 2024
Growth in half year ended Sep 2025 is 31.47% vs -9.22% in Sep 2024
Nine Monthly Results Snapshot (Standalone) - Dec'25
YoY Growth in nine months ended Dec 2025 is 7.53% vs 18.22% in Dec 2024
YoY Growth in nine months ended Dec 2025 is 13.02% vs 6.80% in Dec 2024
Annual Results Snapshot (Standalone) - Mar'26
YoY Growth in year ended Mar 2026 is 12.68% vs 19.19% in Mar 2025
YoY Growth in year ended Mar 2026 is 6.79% vs 12.29% in Mar 2025
About Gujarat Hotels Ltd.

Company Coordinates


