
Compare Aqylon Nexus with Similar Stocks
Dashboard
With HIgh Debt (Debt-Equity Ratio at 10.91 times)- the company has a Weak Long Term Fundamental Strength
- Company's ability to service its debt is weak with a poor EBIT to Interest (avg) ratio of -6.09
- The company has been able to generate a Return on Equity (avg) of 1.04% signifying low profitability per unit of shareholders funds
Flat results in Dec 25
With ROCE of -11.3, it has a Very Expensive valuation with a 87 Enterprise value to Capital Employed
32.43% of Promoter Shares are Pledged
Underperformed the market in the last 1 year
Stock DNA
Media & Entertainment
INR 1,009 Cr (Small Cap)
NA (Loss Making)
21
0.00%
10.91
-386.00%
1,009.59
Total Returns (Price + Dividend) 
Latest dividend: 0.060000000000000005 per share ex-dividend date: Sep-15-2017
Risk Adjusted Returns v/s
Returns Beta

News

Aqylon Nexus Ltd Locks at Upper Circuit With 2.1% Gain — Buyers Queue, Sellers Absent
At Rs 41.52, the buying was done — not because demand dried up, but because the exchange wouldn't let the stock go any higher. Aqylon Nexus Ltd locked at its upper circuit of 2.1% on 29 Jun 2026, with buyers queuing and no sellers willing to part with shares.
Read full news article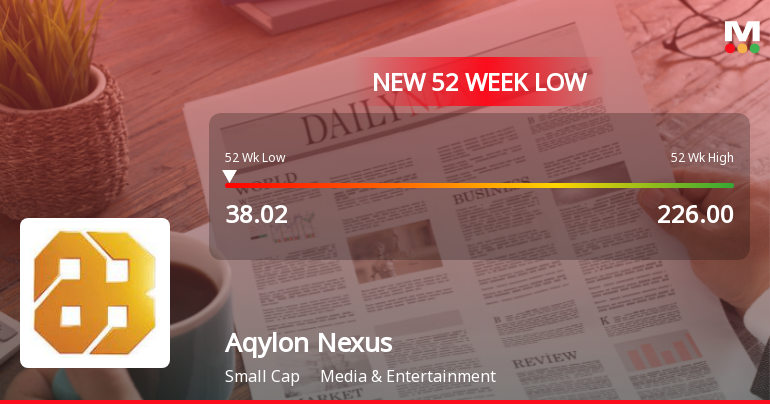
Aqylon Nexus Ltd Falls to 52-Week Low of Rs 38.02 as Sell-Off Deepens
A sustained decline has pushed Aqylon Nexus Ltd to a fresh 52-week low of Rs 38.02 on 29 Jun 2026, marking a steep 55.82% drop over the past year and underscoring the widening gap between the company’s financial performance and its market valuation.
Read full news article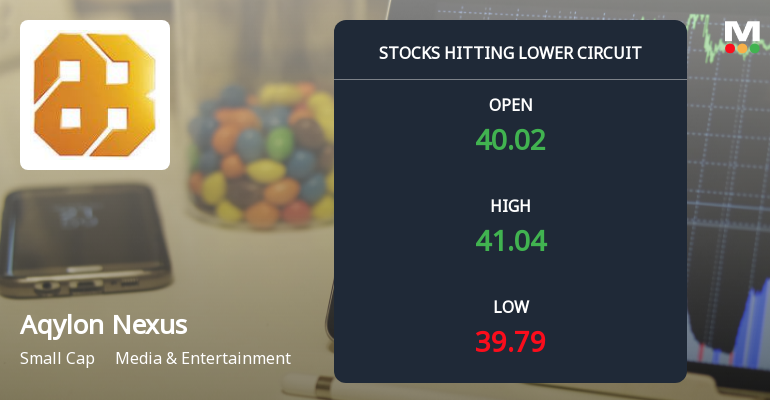
Aqylon Nexus Ltd Locks at Lower Circuit With 4.35% Loss — Sellers Queue, No Buyers in Sight
At Rs 39.55, sellers were still queuing — but there were no buyers willing to take the other side. Aqylon Nexus Ltd locked at its lower circuit of 4.35% on 25 Jun 2026, with unfilled sell orders and a frozen price, signalling persistent selling pressure in a thinly traded stock.
Read full news article Announcements
Closure of Trading Window
25-Jun-2026 | Source : BSEClosure of Trading Window for the quarter ended 30th June 2026
Disclosures under Reg. 29(2) of SEBI (SAST) Regulations 2011
16-Jun-2026 | Source : BSEThe Exchange has received the disclosure under Regulation 29(2) of SEBI (Substantial Acquisition of Shares & Takeovers) Regulations 2011 for Leading Leasing Finance & Investment Company Ltd
Disclosures under Reg. 29(2) of SEBI (SAST) Regulations 2011
15-Jun-2026 | Source : BSEThe Exchange has received the disclosure under Regulation 29(2) of SEBI (Substantial Acquisition of Shares & Takeovers) Regulations 2011 for Leading Leasing Finance & Investment Company Ltd
Corporate Actions

No Upcoming Board Meetings

Aqylon Nexus Ltd has declared 6% dividend, ex-date: 15 Sep 17

Aqylon Nexus Ltd has announced 1:10 stock split, ex-date: 05 Mar 26

No Bonus history available

No Rights history available
Quality key factors
Valuation key factors
Technicals key factors
 Technical Indicator Scale: Bearish, Mildly Bearish, Sideways, Mildly Bullish, Bullish Turned
 Shareholding Snapshot : Mar 2026
Shareholding Compare (%holding)
Promoters
32.4321
Held by 2 Schemes (0.0%)
Held by 8 FIIs (1.57%)
Kurjibhai Premjibhai Rupareliya (58.33%)
Sera Investments & Finance India Ltd. (17.99%)
5.63%
Quarterly Results Snapshot (Standalone) - Mar'26 - QoQ

QoQ Growth in quarter ended Mar 2026 is -21.62% vs 14.06% in Dec 2025
QoQ Growth in quarter ended Mar 2026 is -639.86% vs -89.51% in Dec 2025
Half Yearly Results Snapshot (Standalone) - Sep'25

Growth in half year ended Sep 2025 is 92.95% vs 0.00% in Sep 2024
Growth in half year ended Sep 2025 is 5,012.50% vs 102.25% in Sep 2024
Nine Monthly Results Snapshot (Standalone) - Dec'25
YoY Growth in nine months ended Dec 2025 is 101.51% vs 0.00% in Dec 2024
YoY Growth in nine months ended Dec 2025 is 161.14% vs -40.65% in Dec 2024
Annual Results Snapshot (Standalone) - Mar'26
YoY Growth in year ended Mar 2026 is 119.63% vs 300.67% in Mar 2025
YoY Growth in year ended Mar 2026 is 125.75% vs -3.56% in Mar 2025
About Aqylon Nexus Ltd

Company Coordinates


