
Compare Aqylon Nexus with Similar Stocks
Dashboard
With HIgh Debt (Debt-Equity Ratio at 10.91 times)- the company has a Weak Long Term Fundamental Strength
- Company's ability to service its debt is weak with a poor EBIT to Interest (avg) ratio of -6.09
- The company has been able to generate a Return on Equity (avg) of 1.04% signifying low profitability per unit of shareholders funds
Flat results in Dec 25
With ROCE of -11.3, it has a Very Expensive valuation with a 99.5 Enterprise value to Capital Employed
Falling Participation by Institutional Investors
Underperformed the market in the last 1 year
Stock DNA
Media & Entertainment
INR 1,157 Cr (Small Cap)
NA (Loss Making)
16
0.00%
10.91
-157.00%
1,217.40
Total Returns (Price + Dividend) 
Latest dividend: 0.6 per share ex-dividend date: Sep-15-2017
Risk Adjusted Returns v/s
Returns Beta

News
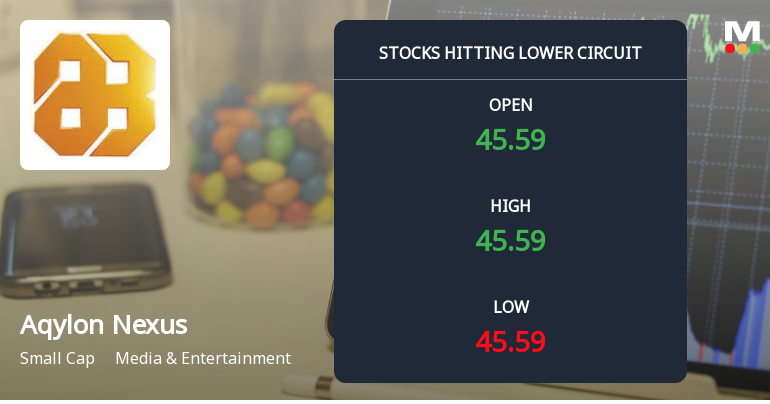
Aqylon Nexus Ltd Locks at Lower Circuit With 4.98% Loss — Sellers Queue, No Buyers in Sight
At Rs 45.77, sellers were still queuing — but there were no buyers willing to take the other side. Aqylon Nexus Ltd locked at its lower circuit of 4.98% on 2 Apr 2026, with unfilled sell orders and a frozen price, signalling persistent selling pressure in a thinly traded stock.
Read full news article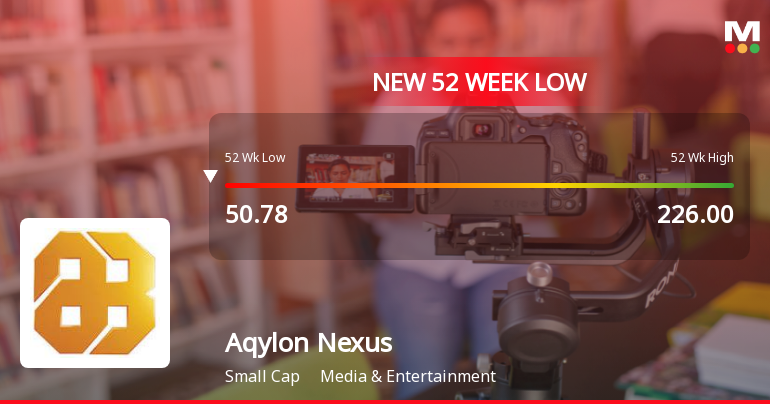
Aqylon Nexus Ltd Falls to 52-Week Low of Rs 45.59 as Sell-Off Deepens
For the eighteenth consecutive session, Aqylon Nexus Ltd closed lower, plunging to a fresh 52-week low of Rs 45.59 on 2 Apr 2026. This marks a staggering 60.03% decline over this losing streak, underscoring persistent selling pressure despite some pockets of market resilience.
Read full news article
Below All Moving Averages and Now at Lower Circuit: Aqylon Nexus Ltd Loses 4.99% in a Single Session
At Rs 48.17, sellers were still queuing — but there were no buyers willing to take the other side. Aqylon Nexus Ltd locked at its lower circuit of 5% on 1 Apr 2026, with unfilled sell orders and a frozen price, signalling persistent selling pressure despite the price floor.
Read full news article Announcements
Disclosures under Reg. 29(2) of SEBI (SAST) Regulations 2011
30-Mar-2026 | Source : BSEThe Exchange has received the disclosure under Regulation 29(2) of SEBI (Substantial Acquisition of Shares & Takeovers) Regulations 2011 for Kurjibhai Rupareliya
Disclosure Under Regulation 30 Of Securities And Exchange Board Of India (Listing Obligations And Disclosure Requirements) Regulations 2015 - Intimation About Execution Of Memorandum Of Understanding (Mou) With AITMC Ventures Private Limited
30-Mar-2026 | Source : BSEDisclosure related to execution of MOU with AITMC Ventures Private Limited
Disclosures under Reg. 29(2) of SEBI (SAST) Regulations 2011
30-Mar-2026 | Source : BSEThe Exchange has received the disclosure under Regulation 29(2) of SEBI (Substantial Acquisition of Shares & Takeovers) Regulations 2011 for Leading Leasing Finance & Investment Company Ltd
Corporate Actions

No Upcoming Board Meetings

Aqylon Nexus Ltd has declared 6% dividend, ex-date: 15 Sep 17

Aqylon Nexus Ltd has announced 1:10 stock split, ex-date: 05 Mar 26

No Bonus history available

No Rights history available
Quality key factors
Valuation key factors
Technicals key factors
 Technical Indicator Scale: Bearish, Mildly Bearish, Sideways, Mildly Bullish, Bullish Turned
 Shareholding Snapshot : Dec 2025
Shareholding Compare (%holding)
Promoters
16.6664
Held by 2 Schemes (0.0%)
Held by 4 FIIs (0.71%)
Kurjibhai Premjibhai Rupareliya (59.12%)
Sera Investments & Finance India Ltd. (18.9%)
4.74%
Quarterly Results Snapshot (Standalone) - Dec'25 - QoQ

QoQ Growth in quarter ended Dec 2025 is 14.06% vs 14,366.67% in Sep 2025
QoQ Growth in quarter ended Dec 2025 is -89.51% vs 866.85% in Sep 2025
Half Yearly Results Snapshot (Standalone) - Sep'25

Growth in half year ended Sep 2025 is 92.95% vs 0.00% in Sep 2024
Growth in half year ended Sep 2025 is 5,012.50% vs 102.25% in Sep 2024
Nine Monthly Results Snapshot (Standalone) - Dec'25
YoY Growth in nine months ended Dec 2025 is 101.51% vs 0.00% in Dec 2024
YoY Growth in nine months ended Dec 2025 is 161.14% vs -40.65% in Dec 2024
Annual Results Snapshot (Consolidated) - Mar'25
YoY Growth in year ended Mar 2025 is 121.38% vs 0.00% in Mar 2024
YoY Growth in year ended Mar 2025 is -5.22% vs 0.00% in Mar 2024
About Aqylon Nexus Ltd

Company Coordinates


