
Compare Renaiss. Global with Similar Stocks
Dashboard
Weak Long Term Fundamental Strength with an average Return on Capital Employed (ROCE) of 8.67%
- Poor long term growth as Net Sales has grown by an annual rate of 6.73% and Operating profit at 18.93% over the last 5 years
Despite the size of the company, domestic mutual funds hold only 0% of the company
Stock DNA
Gems, Jewellery And Watches
INR 1,230 Cr (Micro Cap)
13.00
48
0.00%
0.29
6.53%
0.82
Total Returns (Price + Dividend) 
Latest dividend: 0.5960812772133527 per share ex-dividend date: Jul-19-2022
Risk Adjusted Returns v/s
Returns Beta

News

Renaissance Global Ltd is Rated Sell
Renaissance Global Ltd is rated 'Sell' by MarketsMOJO, with this rating last updated on 29 December 2025. However, the analysis and financial metrics discussed below reflect the company’s current position as of 28 June 2026, providing investors with an up-to-date view of the stock’s fundamentals, valuation, financial trends, and technical outlook.
Read full news article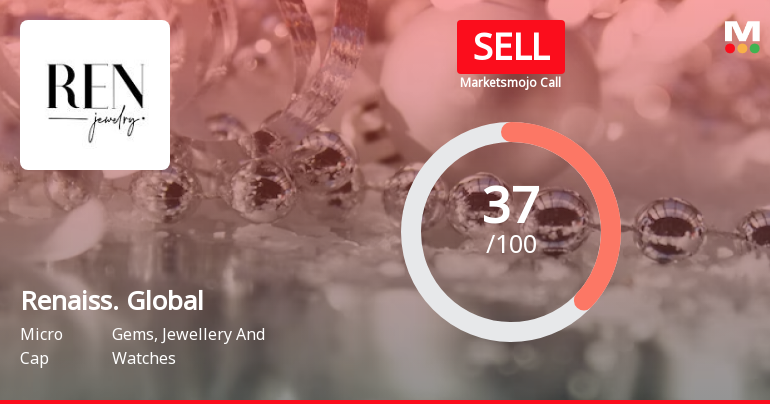
Renaissance Global Ltd is Rated Sell
Renaissance Global Ltd is rated Sell by MarketsMOJO, with this rating last updated on 29 December 2025. However, the analysis and financial metrics discussed here reflect the stock’s current position as of 17 June 2026, providing investors with an up-to-date perspective on the company’s fundamentals, valuation, financial trends, and technical outlook.
Read full news article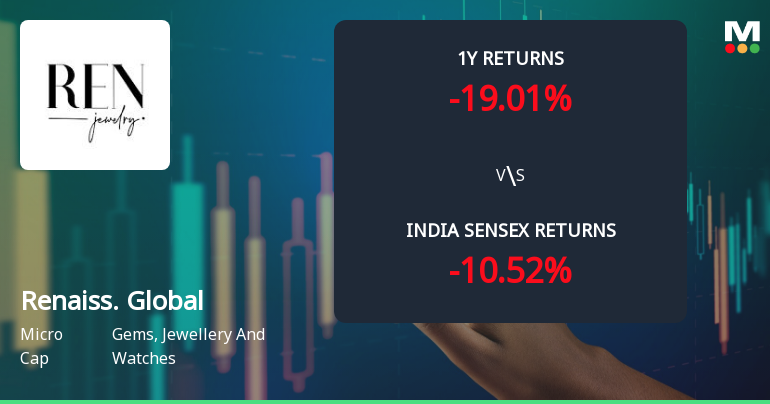
Renaissance Global Ltd Technical Momentum Shifts Amid Mixed Market Signals
Renaissance Global Ltd, a micro-cap player in the Gems, Jewellery and Watches sector, has experienced a notable shift in its technical parameters, reflecting a complex interplay of bullish and bearish signals. Despite a strong intraday rally pushing the stock price to ₹106.85, the overall technical landscape remains cautiously mixed, prompting a downgrade in its Mojo Grade from Hold to Sell as of 29 December 2025.
Read full news article Announcements
Closure of Trading Window
25-Jun-2026 | Source : BSEIntimation of Closure of Trading Window
Announcement under Regulation 30 (LODR)-Allotment of ESOP / ESPS
19-Jun-2026 | Source : BSEAllotment of 34590 Equity Shares pursuant to exercise of ESOP
Announcement under Regulation 30 (LODR)-Allotment of ESOP / ESPS
15-Jun-2026 | Source : BSECorrection in the disclosure submitted under Reg 30 of SEBI (LODR) 2015 dated June 12 2026
Corporate Actions

No Upcoming Board Meetings

Renaissance Global Ltd has declared 30% dividend, ex-date: 19 Jul 22

Renaissance Global Ltd has announced 2:10 stock split, ex-date: 19 Jul 22

No Bonus history available

No Rights history available
Quality key factors
Valuation key factors
Technicals key factors
 Technical Indicator Scale: Bearish, Mildly Bearish, Sideways, Mildly Bullish, Bullish Turned
 Shareholding Snapshot : Mar 2026
Shareholding Compare (%holding)
Promoters
None
Held by 0 Schemes
Held by 8 FIIs (2.02%)
Anived Family Trust (sumit Niranjankumar Shah ) (19.82%)
None
22.97%
Quarterly Results Snapshot (Consolidated) - Mar'26 - YoY

YoY Growth in quarter ended Mar 2026 is 50.35% vs -4.12% in Mar 2025
YoY Growth in quarter ended Mar 2026 is 28.98% vs 27.22% in Mar 2025
Half Yearly Results Snapshot (Consolidated) - Sep'25
Growth in half year ended Sep 2025 is 25.72% vs -6.41% in Sep 2024

Growth in half year ended Sep 2025 is -4.18% vs 8.16% in Sep 2024
Nine Monthly Results Snapshot (Consolidated) - Dec'25
YoY Growth in nine months ended Dec 2025 is 30.20% vs -0.26% in Dec 2024
YoY Growth in nine months ended Dec 2025 is 13.07% vs -3.02% in Dec 2024
Annual Results Snapshot (Consolidated) - Mar'26
YoY Growth in year ended Mar 2026 is 35.18% vs -1.24% in Mar 2025
YoY Growth in year ended Mar 2026 is 18.31% vs 5.22% in Mar 2025
About Renaissance Global Ltd

Company Coordinates


