GRM Overseas

  • Market Cap: Small Cap
  • Industry: Other Agricultural Products
  • ISIN: INE192H01020
  • NSEID: GRMOVER
  • BSEID: 531449
INR
90.28
-0.55 (-0.61%)
BSENSE

Aug 07, 03:30 PM

BSE+NSE Vol: 11.98 lacs

  • Price Points
  • Score
  • Mojo Parameters
  • Total Return
  • News and Corporate Actions
  • Key factors
  • Shareholding
  • Financials
  • CompanyCV
stock-recommendationUpcoming Result: GRM Overseas will declare its result soon on 12 Aug 2026
stock-summaryPrice Point
High/Low

1Day

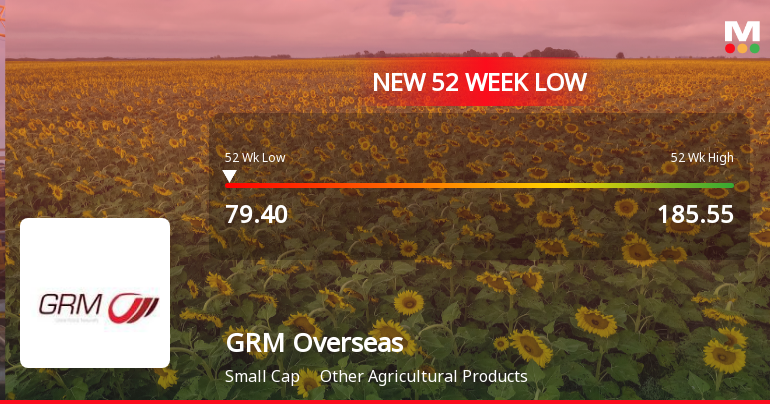
52 Week

Valuation
Technical
Day's Volume

CASH

11.98 lacs (-27.81%) Volume

Shareholding (Jun 2026)

FII

7.28%

Held by 13 FIIs

DII

2.91%

Held by 2 DIIs

Promoter

63.06%

Why is GRM Overseas Ltd falling/rising?

08-Aug-2026

As of 07-Aug, GRM Overseas Ltd's stock price is at 90.28, down 0.61% and has declined 6.48% over the last four days. The stock has significantly underperformed year-to-date and over the past year, raising concerns about its debt servicing capabilities despite some growth in net sales.

As of 07-Aug, GRM Overseas Ltd's stock price is currently at 90.28, reflecting a decrease of 0.55, or 0.61%. The stock has been on a downward trend, having fallen consecutively for the last four days, resulting in a total decline of 6.48% during this period. This underperformance is evident as the stock has also underperformed its sector by 2.97% today.<BR><BR>In terms of longer-term performance, the stock has seen a significant decline of 44.31% year-to-date and a 22.80% drop over the past year, while the broader market, represented by the Sensex, has only decreased by 2.63% in the same timeframe. The stock is trading below its moving averages across various time frames, indicating a bearish trend.<BR><BR>Despite some positive factors, such as a 62.99% growth in net sales over the last six months and an increase in promoter confidence with a 0.55% rise in their stake, the company faces challenges. It has a high Debt to EBITDA ratio of 4.07 times, indicating a low ability to service its debt, which raises concerns among investors. Additionally, the company's operating profit has only grown at an annual rate of 6.26% over the last five years, suggesting poor long-term growth prospects.<BR><BR>Overall, the combination of recent price declines, underperformance relative to the market, and concerns regarding debt servicing capabilities contribute to the current falling stock price of GRM Overseas Ltd.

View full answer

Which are the latest news on GRM Overseas?

07-Aug-2026

When is the next results date for GRM Overseas Ltd?

07-Aug-2026

The next results date for GRM Overseas Ltd is 12 August 2026.

The next results date for GRM Overseas Ltd is scheduled for 12 August 2026.

View full answer

How big is GRM Overseas?

11-Jun-2026

As of 10th June, GRM Overseas Ltd has a market capitalization of 2,070.00 Cr, with recent net sales of 1,769.20 Cr and a net profit of 74.50 Cr.

As of 10th June, GRM Overseas Ltd has a market capitalization of 2,070.00 Cr, categorizing it as a Small Cap company.<BR><BR>In the latest four quarters, GRM Overseas reported Net Sales of 1,769.20 Cr and a Net Profit of 74.50 Cr.<BR><BR>The latest annual period for the balance sheet is March 2025, with Shareholder's Funds amounting to 425.64 Cr and Total Assets of 910.76 Cr.

View full answer

Who are in the management team of GRM Overseas?

11-Jun-2026

The management team of GRM Overseas includes Hukam Chand Garg (Non-Executive Chairman), Atul Garg (Chairman & Managing Director), Nipun Jain (Director), Mamta Garg (Executive Director), and several independent directors: Gautam Gupta, Raj Kumar Garg, Nidhi, and Tarun Singh, along with Manish Kumar as Company Secretary & Compliance Officer. They oversee the company's operations and strategic direction.

The management team of GRM Overseas includes the following individuals:<BR><BR>1. **Hukam Chand Garg** - Chairman (Non-Executive)<BR>2. **Atul Garg** - Chairman & Managing Director<BR>3. **Nipun Jain** - Director<BR>4. **Mamta Garg** - Executive Director<BR>5. **Gautam Gupta** - Independent Director<BR>6. **Raj Kumar Garg** - Independent Director<BR>7. **Nidhi** - Independent Director<BR>8. **Tarun Singh** - Independent Director<BR>9. **Manish Kumar** - Company Secretary & Compliance Officer<BR><BR>This team is responsible for overseeing the company's operations and strategic direction.

View full answer

Who are the peers of the GRM Overseas?

11-Jun-2026

Peers of GRM Overseas include L T Foods, KRBL, Guj. Ambuja Exp, Kaveri Seed Co., and others. GRM Overseas has average management risk and a 1-year return of -24.12%, better than Kaveri Seed Co. but worse than Guj. Ambuja Exp, which has the highest return at 30.27%.

Peers: The peers of GRM Overseas are L T Foods, KRBL, Guj. Ambuja Exp, Kaveri Seed Co., Sanstar, Chamanlal Setia, Gulshan Polyols, AVT Natural Prod, and Krishival Foods.<BR><BR>Quality Snapshot: Excellent management risk is observed at KRBL, Guj. Ambuja Exp, Kaveri Seed Co., and Krishival Foods, while Good management risk is found at L T Foods. Average management risk is present at GRM Overseas, Chamanlal Setia, and Gulshan Polyols, and Below Average management risk is noted at Sanstar. Growth is Excellent at Krishival Foods, Average at L T Foods, and Below Average at GRM Overseas, KRBL, Guj. Ambuja Exp, Kaveri Seed Co., Sanstar, Chamanlal Setia, Gulshan Polyols, and AVT Natural Prod. Capital Structure is Excellent at KRBL, Guj. Ambuja Exp, Kaveri Seed Co., Chamanlal Setia, and AVT Natural Prod, while Good is seen at L T Foods, and Below Average at GRM Overseas and Gulshan Polyols.<BR><BR>Return Snapshot: The peer with the highest 1-year return is Guj. Ambuja Exp at 30.27%, while the lowest is Kaveri Seed Co. at -37.45%. GRM Overseas has a 1-year return of -24.12%, which is better than Kaveri Seed Co. but worse than Guj. Ambuja Exp. Additionally, Kaveri Seed Co. and GRM Overseas have negative six-month returns.

View full answer

What does GRM Overseas do?

10-Jun-2026

GRM Overseas Ltd is a small-cap company involved in the production, purchase, export, and sale of rice and paddy. Established in 1974, it reported net sales of 597 Cr and a net profit of 22 Cr for the quarter ending March 2026.

Overview: <BR>GRM Overseas Ltd is engaged in the production, purchase, export, and sale of rice and paddy, operating within the Other Agricultural Products industry and categorized as a Small Cap company.<BR><BR>History: <BR>GRM Overseas Limited was established in 1974 as a partnership firm, originally known as Garg Rice & General Mills. It became a public limited company on January 3, 1995, and was renamed GRM Overseas Limited. The latest quarterly results reported net sales and profit for the period ending March 2026.<BR><BR>Financial Snapshot: <BR>Most recent Net Sales: 597 Cr (Quarterly Results - Mar 2026) <BR>Most recent Net Profit: 22 Cr (Quarterly Results - Mar 2026) <BR>Market-cap value: INR 2,070 Cr (Small Cap)<BR><BR>Key Metrics: <BR>P/E: 25.00 <BR>Industry P/E: 14 <BR>Dividend Yield: 0.00% <BR>Debt-Equity: 0.49 <BR>Return on Equity: 12.38% <BR>Price to Book: 3.39 <BR><BR>Contact Details: <BR>Address: 128 First Floor Shiva Market, Pitampura New Delhi New Delhi : 110034 <BR>Tel: 91-011-47330330 <BR>Email: cs@grmrice.com <BR>Website: http://www.grmrich.com

View full answer

Should I buy, sell or hold GRM Overseas Ltd?

09-Jun-2026

Are GRM Overseas Ltd latest results good or bad?

05-Feb-2026

GRM Overseas Ltd's latest Q3 FY26 results are strong, with a 41.36% increase in net profit and a 30.05% rise in net sales year-on-year. However, declining operating margins and a high valuation suggest caution regarding future profitability.

GRM Overseas Ltd's latest results for Q3 FY26 indicate a strong performance overall, with several positive highlights. The company reported a net profit of ₹19.14 crore, which represents a significant year-on-year increase of 41.36%. Additionally, net sales reached ₹482.79 crore, reflecting a robust growth of 30.05% compared to the same quarter last year.<BR><BR>Moreover, the company achieved a sequential profit growth of 30.56% from the previous quarter, indicating a positive momentum. The operating margin, while improved from the previous year at 4.44%, has seen a decline from earlier quarters, which raises some concerns about cost pressures.<BR><BR>On the financial front, GRM Overseas has demonstrated impressive capital efficiency with a return on equity of 23.80%, significantly higher than the sector average. However, the stock is currently trading at a high valuation of 45 times trailing earnings, which is above the industry average, suggesting that the market has high expectations for future growth.<BR><BR>In summary, while GRM Overseas has shown strong revenue and profit growth, the declining margins and high valuation raise questions about the sustainability of this performance. Overall, the results can be seen as good, but with caution warranted regarding future profitability and market expectations.

View full answer

How has been the historical performance of GRM Overseas?

13-Nov-2025

GRM Overseas has shown fluctuating financial performance, with net sales increasing to 1,348.19 Cr in Mar'25 but declining from Mar'23 levels. Despite rising costs, the company reported improved operating profit and net cash inflow, indicating resilience in growth.

Answer:<BR>The historical performance of GRM Overseas shows a fluctuating trend in key financial metrics over the years.<BR><BR>Breakdown:<BR>GRM Overseas reported net sales of 1,348.19 Cr in Mar'25, an increase from 1,312.44 Cr in Mar'24, but a decline from 1,379.46 Cr in Mar'23. The total operating income mirrored this trend, reaching 1,348.19 Cr in Mar'25. The raw material cost decreased significantly to 771.86 Cr in Mar'25 from 955.28 Cr in Mar'24, while the purchase of finished goods rose to 411.53 Cr. Total expenditure, excluding depreciation, was 1,268.59 Cr in Mar'25, up from 1,240.25 Cr in Mar'24. Operating profit (PBDIT) was 105.60 Cr in Mar'25, slightly higher than 104.72 Cr in Mar'24, but lower than 111.02 Cr in Mar'23. Profit before tax stood at 84.74 Cr in Mar'25, an increase from 80.46 Cr in Mar'24, while profit after tax was 61.24 Cr, slightly up from 60.72 Cr in Mar'24. The company's total assets increased to 910.76 Cr in Mar'25 from 770.27 Cr in Mar'24, with total liabilities also rising to 910.76 Cr. Cash flow from operating activities improved to 62.00 Cr in Mar'25 from 47.00 Cr in Mar'24, contributing to a net cash inflow of 42.00 Cr in Mar'25. Overall, GRM Overseas has shown resilience with steady growth in sales and profits despite fluctuations in costs and expenditures.

View full answer

Is GRM Overseas technically bullish or bearish?

07-Nov-2025

As of November 6, 2025, GRM Overseas shows a bullish trend supported by strong indicators like MACD and Bollinger Bands, despite mixed signals from the monthly RSI and KST.

As of 6 November 2025, the technical trend for GRM Overseas has changed from mildly bullish to bullish. The current technical stance is bullish with strong indicators supporting this view. The MACD is bullish on both the weekly and monthly time frames, and Bollinger Bands also indicate a bullish trend on both time frames. The daily moving averages confirm a bullish stance as well. However, the monthly RSI shows a bearish signal, and the KST is mildly bearish on the weekly but bullish on the monthly, suggesting some mixed signals. Overall, the strength of the bullish trend is reinforced by the recent price action, with the stock reaching a new high of 446.55 today, indicating positive momentum.

View full answer

Who are the top shareholders of the GRM Overseas?

17-Jul-2025

The top shareholders of GRM Overseas include promoter Hukam Chand Garg with 25.01%, 12 Foreign Institutional Investors holding 0.91%, and public shareholder Pankaj Prasoon And (HUF) with 1.01%. Individual investors own 20.18% of the shares, with no pledged promoter holdings or mutual fund investments.

The top shareholders of GRM Overseas include the promoters, who hold the majority of the shares. The promoter with the highest holding is Hukam Chand Garg, who owns 25.01% of the company. Additionally, there are 12 Foreign Institutional Investors (FIIs) holding a combined 0.91% of the shares. The highest public shareholder is Pankaj Prasoon And (HUF), with a holding of 1.01%. Individual investors collectively hold 20.18% of the shares. There are no pledged promoter holdings and no mutual funds currently invested in the company.

View full answer

Is GRM Overseas overvalued or undervalued?

09-Jun-2025

As of February 13, 2025, GRM Overseas is considered overvalued with a valuation grade of expensive, reflected in its high PE ratio of 28.39 and EV to EBITDA of 25.74, despite a strong year-to-date stock performance of 49.65%.

As of 13 February 2025, the valuation grade for GRM Overseas has moved from fair to expensive, indicating that the company is currently overvalued. The key ratios reflect this assessment, with a PE ratio of 28.39, an EV to EBITDA of 25.74, and a Price to Book Value of 4.08, all of which are significantly higher than those of its peers. For instance, KRBL, a competitor, has a PE ratio of 17.89 and an EV to EBITDA of 12.32, while Chamanlal Setia shows a PE of 18.42 and an EV to EBITDA of 12.35, underscoring GRM's relative overvaluation.<BR><BR>In addition to the high valuation ratios, GRM Overseas has shown impressive stock performance, with a year-to-date return of 49.65%, significantly outpacing the Sensex's 5.61% during the same period. However, despite this strong performance, the current valuation metrics suggest that GRM Overseas is overvalued compared to its peers in the agricultural products sector.

View full answer

What is the bonus history of the GRM Overseas?

06-Jun-2025

GRM Overseas has a bonus history that includes a 2:1 bonus issue announced on July 15, 2021, with a record date of July 16, 2021, allowing shareholders to double their holdings.

GRM Overseas has a bonus history that includes a 2:1 bonus issue, which was announced with an ex-date of July 15, 2021. The record date for this bonus was July 16, 2021. This means that for every share held, shareholders received an additional share, effectively doubling their holdings at that time. If you have any more questions about the company or its financial activities, feel free to ask!

View full answer

Has GRM Overseas declared dividend?

06-Jun-2025

GRM Overseas Ltd has declared a 10% dividend, amounting to ₹0.20 per share, with an ex-date of August 26, 2022. Despite this, the dividend yield is 0%, as total returns have primarily come from price appreciation over various periods.

GRM Overseas Ltd has declared a 10% dividend.<BR><BR>Dividend Details:<BR>- Percentage announced: 10%<BR>- Amount per share: 0.20<BR>- Ex-date: 26 Aug 2022<BR><BR>Dividend Yield: 0%<BR><BR>Total Returns by Period:<BR>In the 6-month period, the price return was 34.3%, with no dividend return, resulting in a total return of 34.3%.<BR><BR>For the 1-year period, the price return was 111.17%, with no dividend return, leading to a total return of 111.17%.<BR><BR>Over the 2-year period, the price return was 65.17%, with no dividend return, culminating in a total return of 65.17%.<BR><BR>In the 3-year period, the price return was -20.91%, with a dividend return of 0.06%, resulting in a total return of -20.85%.<BR><BR>For the 4-year period, the price return was 57.31%, with a dividend return of 3.44%, leading to a total return of 60.75%.<BR><BR>In the 5-year period, the price return was 2608.91%, with a dividend return of 281.88%, resulting in a total return of 2890.79%.<BR><BR>Overall, GRM Overseas has declared a dividend, but the dividend yield remains at 0%. The total returns over the various periods show significant price appreciation, particularly over the longer term, despite the lack of consistent dividend income.

View full answer
iScoreScore
Click here to find our call on this stock
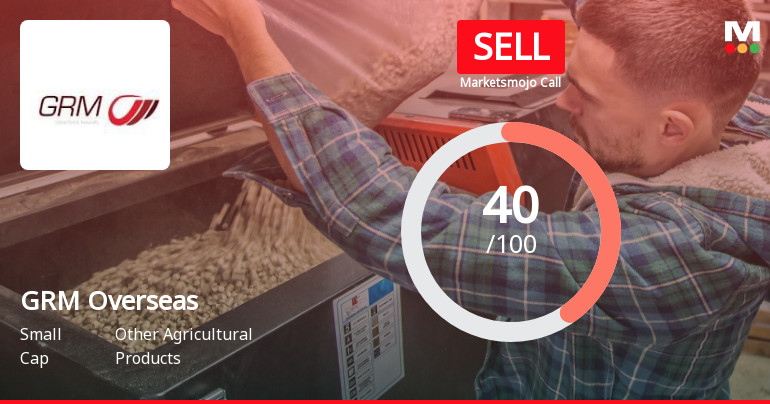
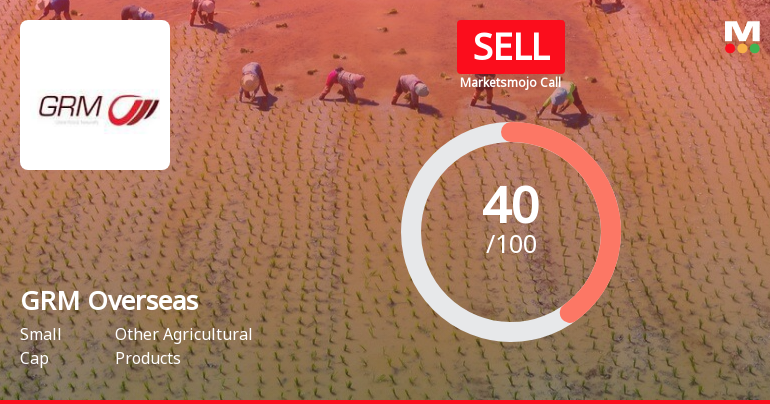
Strong Sell
Sell
Hold
Buy
Strong Buy

Dashboard

1

Low ability to service debt as the company has a high Debt to EBITDA ratio of 4.07 times

  • Low ability to service debt as the company has a high Debt to EBITDA ratio of 4.07 times
2

Poor long term growth as Operating profit has grown by an annual rate 6.26% of over the last 5 years

 
3

Underperformed the market in the last 1 year

stock-summaryMojo Parameters

Mojo Parameters

Loading Valuation Snapshot...

Stock DNA

stock-summary
Industry

Other Agricultural Products

stock-summary
Market cap

INR 1,881 Cr (Small Cap)

stock-summary
P/E

25.00

stock-summary
Industry P/E

14

stock-summary
Dividend Yield

0.00%

stock-summary
Debt Equity

0.49

stock-summary
Return on Equity

12.38%

stock-summary
Price to Book

3.13

Revenue and Profits:
Net Sales:
597 Cr
(Quarterly Results - Mar 2026)
Net Profit:
22 Cr
stock-summaryTotal Returns
Total Returns (Price + Dividend) stock-summary
Dividend Yield (0%)
TimePeriod
Price Return
Dividend Return
Total Return
3 Months
-45.14%
0%
-45.14%
6 Months
-45.38%
0%
-45.38%
1 Year
-22.8%
0%
-22.8%
2 Years
34.11%
0%
34.11%
3 Years
57.42%
0%
57.42%
4 Years
-30.22%
0%
-30.22%
5 Years
83.79%
1.24%
85.03%

Latest dividend: 0.06666666666666667 per share ex-dividend date: Aug-26-2022

Risk Adjusted Returns v/s stock-summary
Returns Beta
Icon
Beta has not been calculated since enough price history is not available
stock-summaryNews & Corporate Actions

Announcements stock-summary

Board Meeting Intimation for To Consider And Approve The Unaudited Standalone And Consolidated Financial Results Of The Company For The Quarter Ended 30Th June 2026.

06-Aug-2026 | Source : BSE

GRM Overseas Ltdhas informed BSE that the meeting of the Board of Directors of the Company is scheduled on 12/08/2026 inter alia to consider and approve the unaudited Standalone and Consolidated Financial Results of the Company for the quarter ended 30th June 2026.

Announcement under Regulation 30 (LODR)-Credit Rating

21-Jul-2026 | Source : BSE

Rating upgraded by Acuite Ratings & Research Limited from A- to A (Stable outlook)

Compliances-Certificate under Reg. 74 (5) of SEBI (DP) Regulations 2018

13-Jul-2026 | Source : BSE

Compliance Certificate under Reg 74(5) of SEBI (DP) Regulations 2015

Corporate Actions stock-summary

stock-summary
BOARD MEETING

12 Aug 2026

stock-summary
DIVIDEND

GRM Overseas Ltd has declared 10% dividend, ex-date: 26 Aug 22

stock-summary
SPLITS

GRM Overseas Ltd has announced 2:10 stock split, ex-date: 10 Nov 21

stock-summary
BONUS

GRM Overseas Ltd has announced 2:1 bonus issue, ex-date: 24 Dec 25

stock-summary
RIGHTS

No Rights history available

stock-summaryKey Factors

Quality key factors stock-summary

Factor
Value
Sales Growth (5y)
17.22%
EBIT Growth (5y)
6.26%
EBIT to Interest (avg)
4.62
Debt to EBITDA (avg)
3.47
Net Debt to Equity (avg)
0.49
Sales to Capital Employed (avg)
2.18
Tax Ratio
24.53%
Dividend Payout Ratio
0
Pledged Shares
0.03%
Institutional Holding
10.19%
ROCE (avg)
14.33%
ROE (avg)
21.83%

Valuation key factors

Factor
Value
P/E Ratio
25
Industry P/E
14
Price to Book Value
3.07
EV to EBIT
24.66
EV to EBITDA
23.72
EV to Capital Employed
2.39
EV to Sales
1.21
PEG Ratio
4.36
Dividend Yield
NA
ROCE (Latest)
9.70%
ROE (Latest)
12.38%

Technicals key factors

Indicator
Weekly
Monthly
MACD
Bearish
Mildly Bearish
RSI
No Signal
No Signal
Bollinger Bands
Bearish
Bearish
Moving Averages
Bearish (Daily)
KST
Bearish
Mildly Bearish
Dow Theory
Mildly Bearish
No Trend
OBV
Mildly Bearish
No Trend
stock-summary Technical Indicator Scale: Bearish, Mildly Bearish, Sideways, Mildly Bullish, Bullish  Turned 
stock-summaryShareholding
Shareholding Snapshot : Jun 2026stock-summary
Shareholding Compare (%holding) stock-summary
Majority shareholders

Promoters

Pledged Promoter Holdings

0.0252

Mutual Funds

Held by 0 Schemes

FIIs

Held by 13 FIIs (7.28%)

Promoter with highest holding

Hukam Chand Garg (21.88%)

Highest Public shareholder

Singularity Equity Fund I (2.91%)

Individual Investors Holdings

16.92%

stock-summaryFinancial
[
  {
    "link": "quarterly",
    "btn_text": "All Quarterly Results",
    "header": "Quarterly Results Snapshot (Consolidated) - Mar'26 - QoQ",
    "rhs": [
      {
        "prefix": "Net Sales ",
        "suffix": "QoQ Growth in quarter ended Mar 2026 is 23.70% vs 33.21% in Dec 2025",
        "dir": -1
      },
      {
        "prefix": "Consolidated Net Profit ",
        "suffix": "QoQ Growth in quarter ended Mar 2026 is 12.90% vs 30.56% in Dec 2025",
        "dir": -1
      }
    ],
    "table": {
      "header": [
        "Mar'26",
        "Dec'25",
        "Change(%)"
      ],
      "body": [
        {
          "field": "Net Sales",
          "val1": "597.20",
          "val2": "482.79",
          "chgp": "23.70%",
          "chgp_class": "positive"
        },
        {
          "field": "Operating Profit (PBDIT) excl Other Income",
          "val1": "30.10",
          "val2": "21.43",
          "chgp": "40.46%",
          "chgp_class": "positive"
        },
        {
          "field": "Interest",
          "val1": "7.29",
          "val2": "4.93",
          "chgp": "47.87%",
          "chgp_class": "negative"
        },
        {
          "field": "Exceptional Items",
          "val1": "0.00",
          "val2": "0.00",
          "chgp": "",
          "chgp_class": "neutral"
        },
        {
          "field": "Consolidate Net Profit",
          "val1": "21.61",
          "val2": "19.14",
          "chgp": "12.90%",
          "chgp_class": "positive"
        },
        {
          "field": "Operating Profit Margin (Excl OI)",
          "val1": "5.04%",
          "val2": "4.44%",
          "chgp": "0.60%",
          "chgp_class": "positive"
        }
      ]
    }
  },
  {
    "link": "half-yearly",
    "btn_text": "All Half Yearly Results",
    "header": "Half Yearly Results Snapshot (Consolidated) - Sep'25",
    "rhs": [
      {
        "prefix": "Net Sales ",
        "suffix": " Growth in half year ended Sep 2025 is 0.53% vs 30.82% in Sep 2024",
        "dir": -1
      },
      {
        "prefix": "Consolidated Net Profit ",
        "suffix": " Growth in half year ended Sep 2025 is 24.36% vs 13.13% in Sep 2024",
        "dir": 1
      }
    ],
    "table": {
      "header": [
        "Sep'25",
        "Sep'24",
        "Change(%)"
      ],
      "body": [
        {
          "field": "Net Sales",
          "val1": "689.21",
          "val2": "685.56",
          "chgp": "0.53%",
          "chgp_class": "positive"
        },
        {
          "field": "Operating Profit (PBDIT) excl Other Income",
          "val1": "38.77",
          "val2": "34.60",
          "chgp": "12.05%",
          "chgp_class": "positive"
        },
        {
          "field": "Interest",
          "val1": "10.52",
          "val2": "6.00",
          "chgp": "75.33%",
          "chgp_class": "negative"
        },
        {
          "field": "Exceptional Items",
          "val1": "0.00",
          "val2": "0.00",
          "chgp": "",
          "chgp_class": "neutral"
        },
        {
          "field": "Consolidate Net Profit",
          "val1": "33.85",
          "val2": "27.22",
          "chgp": "24.36%",
          "chgp_class": "positive"
        },
        {
          "field": "Operating Profit Margin (Excl OI)",
          "val1": "5.63%",
          "val2": "5.05%",
          "chgp": "0.58%",
          "chgp_class": "positive"
        }
      ]
    }
  },
  {
    "link": "nine-monthly",
    "btn_text": "All Nine Monthly Results",
    "header": "Nine Monthly Results Snapshot (Consolidated) - Dec'25",
    "rhs": [
      {
        "prefix": "Net Sales ",
        "suffix": "YoY Growth in nine months ended Dec 2025 is 10.90% vs 16.58% in Dec 2024",
        "dir": -1
      },
      {
        "prefix": "Consolidated Net Profit ",
        "suffix": "YoY Growth in nine months ended Dec 2025 is 30.00% vs 3.06% in Dec 2024",
        "dir": 1
      }
    ],
    "table": {
      "header": [
        "Dec'25",
        "Dec'24",
        "Change(%)"
      ],
      "body": [
        {
          "field": "Net Sales",
          "val1": "1,172.00",
          "val2": "1,056.80",
          "chgp": "10.90%",
          "chgp_class": "positive"
        },
        {
          "field": "Operating Profit (PBDIT) excl Other Income",
          "val1": "60.20",
          "val2": "46.94",
          "chgp": "28.25%",
          "chgp_class": "positive"
        },
        {
          "field": "Interest",
          "val1": "15.45",
          "val2": "9.79",
          "chgp": "57.81%",
          "chgp_class": "negative"
        },
        {
          "field": "Exceptional Items",
          "val1": "0.00",
          "val2": "0.00",
          "chgp": "",
          "chgp_class": "neutral"
        },
        {
          "field": "Consolidate Net Profit",
          "val1": "52.99",
          "val2": "40.76",
          "chgp": "30.00%",
          "chgp_class": "positive"
        },
        {
          "field": "Operating Profit Margin (Excl OI)",
          "val1": "5.14%",
          "val2": "4.44%",
          "chgp": "0.70%",
          "chgp_class": "positive"
        }
      ]
    }
  },
  {
    "link": "annual",
    "btn_text": "All Annual Results",
    "header": "Annual Results Snapshot (Consolidated) - Mar'26",
    "rhs": [
      {
        "prefix": "Net Sales ",
        "suffix": "YoY Growth in year ended Mar 2026 is 31.23% vs 2.72% in Mar 2025",
        "dir": 1
      },
      {
        "prefix": "Consolidated Net Profit ",
        "suffix": "YoY Growth in year ended Mar 2026 is 21.39% vs 0.86% in Mar 2025",
        "dir": 1
      }
    ],
    "table": {
      "header": [
        "Mar'26",
        "Mar'25",
        "Change(%)"
      ],
      "body": [
        {
          "field": "Net Sales",
          "val1": "1,769.20",
          "val2": "1,348.19",
          "chgp": "31.23%",
          "chgp_class": "positive"
        },
        {
          "field": "Operating Profit (PBDIT) excl Other Income",
          "val1": "90.30",
          "val2": "79.60",
          "chgp": "13.44%",
          "chgp_class": "positive"
        },
        {
          "field": "Interest",
          "val1": "22.74",
          "val2": "17.76",
          "chgp": "28.04%",
          "chgp_class": "negative"
        },
        {
          "field": "Exceptional Items",
          "val1": "0.00",
          "val2": "0.00",
          "chgp": "",
          "chgp_class": "neutral"
        },
        {
          "field": "Consolidate Net Profit",
          "val1": "74.34",
          "val2": "61.24",
          "chgp": "21.39%",
          "chgp_class": "positive"
        },
        {
          "field": "Operating Profit Margin (Excl OI)",
          "val1": "5.10%",
          "val2": "5.90%",
          "chgp": "-0.80%",
          "chgp_class": "negative"
        }
      ]
    }
  }
]

Quarterly Results Snapshot (Consolidated) - Mar'26 - QoQstock-summary

Mar'26
Dec'25
Change(%)
Net Sales
597.20
482.79
23.70%
Operating Profit (PBDIT) excl Other Income
30.10
21.43
40.46%
Interest
7.29
4.93
47.87%
Exceptional Items
0.00
0.00
Consolidate Net Profit
21.61
19.14
12.90%
Operating Profit Margin (Excl OI)
5.04%
4.44%
0.60%
Values in Rs Cr.
Direction Arrows
Net Sales

QoQ Growth in quarter ended Mar 2026 is 23.70% vs 33.21% in Dec 2025

Direction Arrows
Consolidated Net Profit

QoQ Growth in quarter ended Mar 2026 is 12.90% vs 30.56% in Dec 2025

Half Yearly Results Snapshot (Consolidated) - Sep'25stock-summary

Sep'25
Sep'24
Change(%)
Net Sales
689.21
685.56
0.53%
Operating Profit (PBDIT) excl Other Income
38.77
34.60
12.05%
Interest
10.52
6.00
75.33%
Exceptional Items
0.00
0.00
Consolidate Net Profit
33.85
27.22
24.36%
Operating Profit Margin (Excl OI)
5.63%
5.05%
0.58%
Values in Rs Cr.
Direction Arrows
Net Sales

Growth in half year ended Sep 2025 is 0.53% vs 30.82% in Sep 2024

Direction Arrows
Consolidated Net Profit

Growth in half year ended Sep 2025 is 24.36% vs 13.13% in Sep 2024

Nine Monthly Results Snapshot (Consolidated) - Dec'25stock-summary

Dec'25
Dec'24
Change(%)
Net Sales
1,172.00
1,056.80
10.90%
Operating Profit (PBDIT) excl Other Income
60.20
46.94
28.25%
Interest
15.45
9.79
57.81%
Exceptional Items
0.00
0.00
Consolidate Net Profit
52.99
40.76
30.00%
Operating Profit Margin (Excl OI)
5.14%
4.44%
0.70%
Values in Rs Cr.
Direction Arrows
Net Sales

YoY Growth in nine months ended Dec 2025 is 10.90% vs 16.58% in Dec 2024

Direction Arrows
Consolidated Net Profit

YoY Growth in nine months ended Dec 2025 is 30.00% vs 3.06% in Dec 2024

Annual Results Snapshot (Consolidated) - Mar'26stock-summary

Mar'26
Mar'25
Change(%)
Net Sales
1,769.20
1,348.19
31.23%
Operating Profit (PBDIT) excl Other Income
90.30
79.60
13.44%
Interest
22.74
17.76
28.04%
Exceptional Items
0.00
0.00
Consolidate Net Profit
74.34
61.24
21.39%
Operating Profit Margin (Excl OI)
5.10%
5.90%
-0.80%
Values in Rs Cr.
Direction Arrows
Net Sales

YoY Growth in year ended Mar 2026 is 31.23% vs 2.72% in Mar 2025

Direction Arrows
Consolidated Net Profit

YoY Growth in year ended Mar 2026 is 21.39% vs 0.86% in Mar 2025

stock-summaryCompany CV
About GRM Overseas Ltd stock-summary
stock-summary
GRM Overseas Ltd
Small Cap
Other Agricultural Products
GRM Overseas Limited was established as a partnership firm in the year 1974. It was earlier known as Garg Rice & General Mills and on January 3, 1995 and was converted into a public limited company and the name was changed to GRM Overseas Limited. The Company engages in the production, purchase, export, and sale of rice and paddy in India. It manufactures polythene. It has processing unit at Panipat in Haryana with capacity to process almond kernels, paddy, clove, pista, rice, and wheat.
Company Coordinates stock-summary
Company Details
128 First Floor Shiva Market, Pitampura New Delhi New Delhi : 110034
stock-summary
Tel: 91-011-47330330
stock-summary
cs@grmrice.com
Registrar Details
Abhipra Capital Ltd , Abhipra Complex, A-387 Azadpur, Dilkush Indl.Area G T Karnal Road , New Delhi