
Compare Fruition Venture with Similar Stocks
Dashboard
Weak Long Term Fundamental Strength with a -0.81% CAGR growth in Operating Profits over the last 5 years
- Company's ability to service its debt is weak with a poor EBIT to Interest (avg) ratio of 0.11
- The company has been able to generate a Return on Equity (avg) of 3.18% signifying low profitability per unit of shareholders funds
Flat results in Mar 26
With ROE of -18.6, it has a Expensive valuation with a 3.5 Price to Book Value
Stock DNA
Trading & Distributors
INR 19 Cr (Micro Cap)
NA (Loss Making)
23
0.00%
0.07
-18.63%
3.54
Total Returns (Price + Dividend) 
Fruition Venture for the last several years.
Risk Adjusted Returns v/s
Returns Beta

News
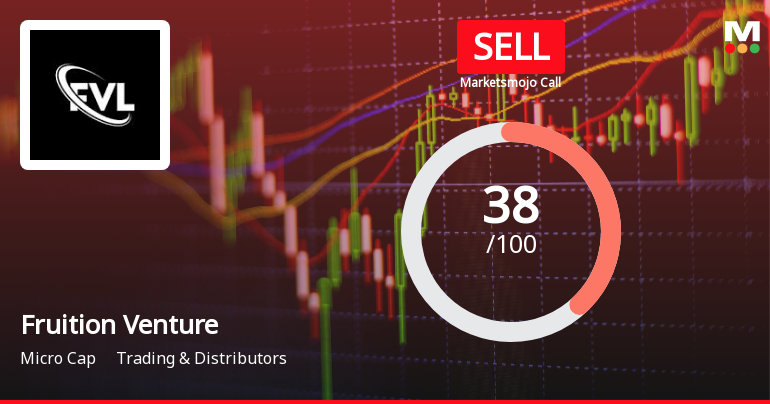
Fruition Venture Ltd Upgraded to Sell on Technical Improvements Despite Weak Fundamentals
Fruition Venture Ltd has seen its investment rating upgraded from Strong Sell to Sell, driven primarily by a shift in technical indicators signalling a mildly bullish trend. However, the company’s fundamental and valuation metrics remain weak, reflecting ongoing challenges in profitability and financial health amid a volatile market backdrop.
Read full news article
Announcements
Appointment of Company Secretary and Compliance Officer
20-Jul-2026 | Source : BSEAppointment of Mr. Amit Jain as a Company Secretary and Compliance Officer with effect from 20th July 2026.
Board Meeting Outcome for Appointment Of Mr. Amit Jain As A Company Secretary And Compliance Officer
20-Jul-2026 | Source : BSEAppointment of Mr. Amit Jain as a Company Secretary and Compliance Officer with effect from 20th July 2026
Compliances-Certificate under Reg. 74 (5) of SEBI (DP) Regulations 2018
06-Jul-2026 | Source : BSECompliance Regulation 74(5) of SEBI (DP) Regulation 2018 for the quarter ended June 30 2026
Corporate Actions

No Upcoming Board Meetings

No Dividend history available

No Splits history available

No Bonus history available

No Rights history available
Quality key factors
Valuation key factors
Technicals key factors
 Technical Indicator Scale: Bearish, Mildly Bearish, Sideways, Mildly Bullish, Bullish Turned
 Shareholding Snapshot : Jun 2026
Shareholding Compare (%holding)
Promoters
None
Held by 0 Schemes
Held by 0 FIIs
Krishan Kumar Aggarwal (36.59%)
Nishant Inbuild Limited (2.85%)
39.72%
Quarterly Results Snapshot (Standalone) - Mar'26 - QoQ

QoQ Growth in quarter ended Mar 2026 is -9.20% vs 61.39% in Dec 2025
QoQ Growth in quarter ended Mar 2026 is -709.09% vs 633.33% in Dec 2025
Half Yearly Results Snapshot (Standalone) - Sep'25

Growth in half year ended Sep 2025 is 41.89% vs 0.00% in Sep 2024
Growth in half year ended Sep 2025 is 300.00% vs 46.15% in Sep 2024
Nine Monthly Results Snapshot (Standalone) - Dec'25
YoY Growth in nine months ended Dec 2025 is 47.43% vs 0.00% in Dec 2024
YoY Growth in nine months ended Dec 2025 is 376.92% vs 0.00% in Dec 2024
Annual Results Snapshot (Standalone) - Mar'26
YoY Growth in year ended Mar 2026 is 43.25% vs 2,168.75% in Mar 2025
YoY Growth in year ended Mar 2026 is -345.45% vs 38.89% in Mar 2025
About Fruition Venture Ltd

Company Coordinates


