
Compare Fruition Venture with Similar Stocks
Dashboard
Weak Long Term Fundamental Strength with a -0.81% CAGR growth in Operating Profits over the last 5 years
- Company's ability to service its debt is weak with a poor EBIT to Interest (avg) ratio of 0.11
- The company has been able to generate a Return on Equity (avg) of 3.18% signifying low profitability per unit of shareholders funds
Flat results in Mar 26
With ROE of -18.6, it has a Expensive valuation with a 2.1 Price to Book Value
Stock DNA
Trading & Distributors
INR 11 Cr (Micro Cap)
NA (Loss Making)
15
0.00%
0.07
-18.63%
2.17
Total Returns (Price + Dividend) 
Fruition Venture for the last several years.
Risk Adjusted Returns v/s
Returns Beta

News
Are Fruition Venture Ltd latest results good or bad?
Fruition Venture Ltd's latest financial results for Q4 FY26 reveal a complex operational landscape. The company reported net sales of ₹1.48 crores, reflecting a year-on-year growth of 34.55%, which indicates a positive trend in revenue generation. However, this growth was overshadowed by a sequential decline of 9.20% compared to the previous quarter, highlighting potential volatility in business volumes. A significant concern arises from the company's net profit, which recorded a loss of ₹1.34 crores, contrasting sharply with a profit of ₹0.22 crores in Q3 FY26. This resulted in a profit after tax margin of -90.54%, marking one of the lowest quarterly performances in recent history. The extraordinary tax charge of ₹1.37 crores, which exceeded the company's entire revenue for the quarter, raises serious questions about financial management and sustainability. The operating margin also faced challenges, dec...
Read full news article
Fruition Venture Q4 FY26: Tax Anomaly Triggers ₹1.34 Crore Loss Despite Revenue Growth
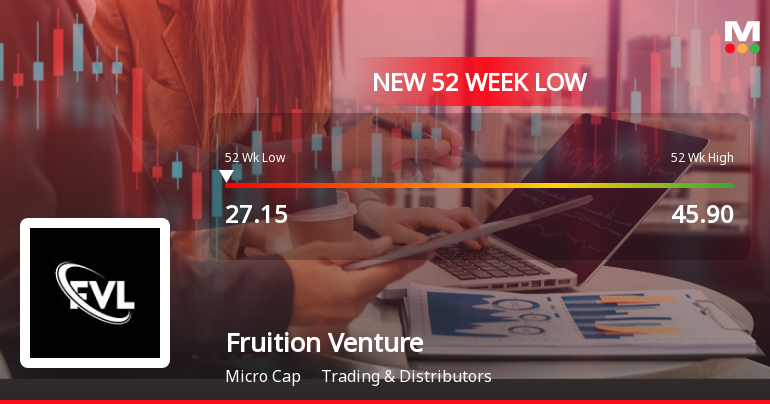
Fruition Venture Ltd., a micro-cap trading and distribution company with a market capitalisation of ₹14.00 crores, reported a net loss of ₹1.34 crores in Q4 FY26, marking a dramatic reversal from the ₹0.22 crore profit recorded in the previous quarter. The loss stemmed from an extraordinary tax charge of ₹1.37 crores—representing an anomalous 4,566.67% tax rate—despite the company posting pre-tax profit of just ₹0.03 crores. Investors responded negatively, with the stock trading at ₹35.94 following the results announcement, down 21.70% from its 52-week high of ₹45.90.
Read full news article Announcements
Announcement under Regulation 30 (LODR)-Newspaper Publication
30-May-2026 | Source : BSEIntimation of Newspaper Publication - Audited Financial Results standalone for the quarter and year ended on 31.03.2026.
Board Meeting Outcome for Outcome For The Board Meeting Held On 29TH May 2026 For Approval Of Audited Financial Results For Quarter And Year Ended 31St March 2026 Commenced At 03:00 PM And Concluded At 05:00 PM.
29-May-2026 | Source : BSEOutcome for the Board meeting held on 29TH May 2026 for approval of audited Financial results for quarter and year ended 31st March 2026 commenced at 03:00 PM and concluded at 05:00 PM.
Outcome For The Board Meeting Held On 29TH May 2026 For Approval Of Audited Financial Results For Quarter And Year Ended 31St March 2026 Commenced At 03:00 PM And Concluded At 05:00 PM.
29-May-2026 | Source : BSEoutcome for the board meeting held on 29th may 2026 for approval of audited financial results for quarter and year ended 31st march 2026 commenced at 03:00 PM and concluded at 05:00 PM
Corporate Actions

No Upcoming Board Meetings

No Dividend history available

No Splits history available

No Bonus history available

No Rights history available
Quality key factors
Valuation key factors
Technicals key factors
 Technical Indicator Scale: Bearish, Mildly Bearish, Sideways, Mildly Bullish, Bullish Turned
 Shareholding Snapshot : Mar 2026
Shareholding Compare (%holding)
Promoters
None
Held by 0 Schemes
Held by 0 FIIs
Krishan Kumar Aggarwal (36.59%)
Narendra Shah (1.59%)
39.39%
Quarterly Results Snapshot (Standalone) - Mar'26 - QoQ

QoQ Growth in quarter ended Mar 2026 is -9.20% vs 61.39% in Dec 2025
QoQ Growth in quarter ended Mar 2026 is -709.09% vs 633.33% in Dec 2025
Half Yearly Results Snapshot (Standalone) - Sep'25

Growth in half year ended Sep 2025 is 41.89% vs 0.00% in Sep 2024
Growth in half year ended Sep 2025 is 300.00% vs 46.15% in Sep 2024
Nine Monthly Results Snapshot (Standalone) - Dec'25
YoY Growth in nine months ended Dec 2025 is 47.43% vs 0.00% in Dec 2024
YoY Growth in nine months ended Dec 2025 is 376.92% vs 0.00% in Dec 2024
Annual Results Snapshot (Standalone) - Mar'26
YoY Growth in year ended Mar 2026 is 43.25% vs 2,168.75% in Mar 2025
YoY Growth in year ended Mar 2026 is -345.45% vs 38.89% in Mar 2025
About Fruition Venture Ltd

Company Coordinates


