
Compare Rushil Decor with Similar Stocks
Dashboard
Weak Long Term Fundamental Strength with an average Return on Capital Employed (ROCE) of 9.29%
- Poor long term growth as Operating profit has grown by an annual rate 7.85% of over the last 5 years
- Low ability to service debt as the company has a high Debt to EBITDA ratio of 3.67 times
Flat results in Mar 26
Consistent Underperformance against the benchmark over the last 3 years
Stock DNA
Plywood Boards/ Laminates
INR 432 Cr (Micro Cap)
63.00
18
0.67%
0.39
1.26%
0.66
Total Returns (Price + Dividend) 
Latest dividend: 0.10000000000000002 per share ex-dividend date: Sep-12-2025
Risk Adjusted Returns v/s
Returns Beta

News

Rushil Decor Ltd is Rated Strong Sell
Rushil Decor Ltd is rated Strong Sell by MarketsMOJO, with this rating last updated on 10 Nov 2025. However, the analysis and financial metrics discussed here reflect the company’s current position as of 10 June 2026, providing investors with an up-to-date view of the stock’s fundamentals, returns, and technical outlook.
Read full news articleAre Rushil Decor Ltd latest results good or bad?
Rushil Decor Ltd's latest financial results for Q4 FY26 present a mixed picture of performance. The company reported a net profit of ₹10.12 crores, reflecting a significant sequential rebound of 90.94% from the previous quarter. However, this figure represents a decline of 20.57% compared to the same quarter last year. Revenue for the quarter was ₹230.90 crores, showing a modest sequential increase of 6.63% from ₹216.54 crores in Q3 FY26, but only a slight growth of 0.07% year-on-year, which raises concerns about the company's ability to sustain top-line growth. The operating margin improved to 11.47%, marking the highest level in recent quarters, yet it remains below the margins achieved in earlier periods. The net profit margin also saw a sequential improvement but trailed behind the previous year's performance, indicating ongoing structural cost pressures. In terms of capital efficiency, the company's ...
Read full news article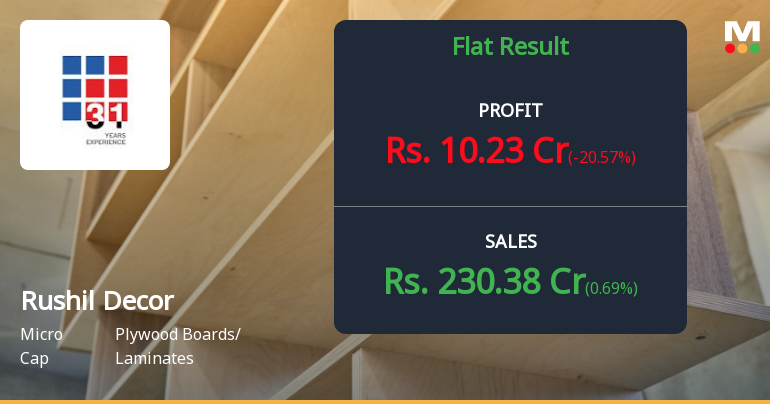
Rushil Decor Q4 FY26: Profit Recovery Masks Deeper Structural Concerns
Rushil Decor Ltd., a micro-cap laminate and particle board manufacturer, reported consolidated net profit of ₹10.12 crores for Q4 FY26, representing a sharp recovery of 90.94% quarter-on-quarter from the ₹5.30 crores posted in Q3 FY26. However, the year-on-year comparison reveals a concerning 20.57% decline from ₹12.74 crores in Q4 FY25, underscoring persistent challenges in sustaining profitability despite top-line stability.
Read full news article Announcements
Announcement under Regulation 30 (LODR)-Earnings Call Transcript
09-Jun-2026 | Source : BSETranscript of Conference Call for the Quarter and Financial Year ended March 31 2026
Updation About Regularisation Of Commercial Operations At RHPL Laminate Sheets Manufacturing Unit At Mansa Gujarat
08-Jun-2026 | Source : BSEUpdation about Regularisation of Commercial Operations at RHPL Laminate Sheets Manufacturing Unit at Mansa Gujarat
Announcement under Regulation 30 (LODR)-Analyst / Investor Meet - Outcome
03-Jun-2026 | Source : BSEAudio recording of the conference call for Audited Standalone and Consolidated Financial Results for the Quarter and Year ended March 31 2026
Corporate Actions

No Upcoming Board Meetings

Rushil Decor Ltd has declared 10% dividend, ex-date: 12 Sep 25

Rushil Decor Ltd has announced 1:10 stock split, ex-date: 09 Aug 24

No Bonus history available

Rushil Decor Ltd has announced 1:3 rights issue, ex-date: 13 Apr 23
Quality key factors
Valuation key factors
Technicals key factors
 Technical Indicator Scale: Bearish, Mildly Bearish, Sideways, Mildly Bullish, Bullish Turned
 Shareholding Snapshot : Mar 2026
Shareholding Compare (%holding)
Promoters
None
Held by 0 Schemes
Held by 9 FIIs (1.29%)
Krupesh Ghanshyambhai Thakkar (13.99%)
Tirthankar Shares And Services Pvt (1.72%)
33.23%
Quarterly Results Snapshot (Standalone) - Mar'26 - YoY

YoY Growth in quarter ended Mar 2026 is 0.69% vs -1.98% in Mar 2025

YoY Growth in quarter ended Mar 2026 is -20.57% vs 43.11% in Mar 2025
Half Yearly Results Snapshot (Standalone) - Sep'25
Growth in half year ended Sep 2025 is -9.20% vs 13.76% in Sep 2024
Growth in half year ended Sep 2025 is -132.25% vs 5.10% in Sep 2024
Nine Monthly Results Snapshot (Standalone) - Dec'25
YoY Growth in nine months ended Dec 2025 is -5.55% vs 8.51% in Dec 2024
YoY Growth in nine months ended Dec 2025 is -105.76% vs 3.84% in Dec 2024
Annual Results Snapshot (Standalone) - Mar'26
YoY Growth in year ended Mar 2026 is -3.95% vs 5.61% in Mar 2025
YoY Growth in year ended Mar 2026 is -83.04% vs 12.04% in Mar 2025
About Rushil Decor Ltd

Company Coordinates


