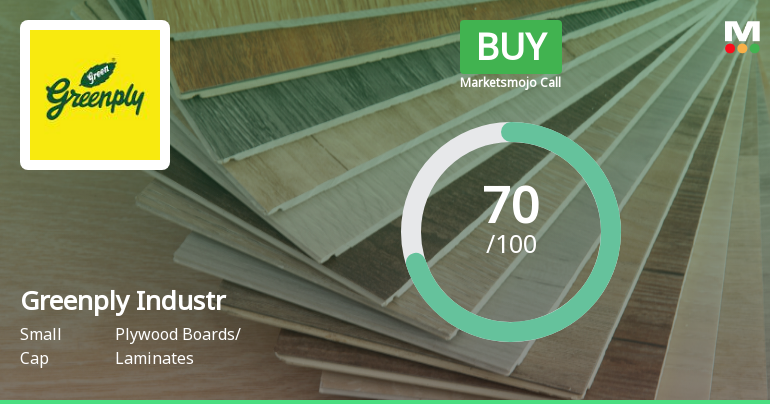
Greenply Industr

  • Market Cap: Small Cap
  • Industry: Plywood Boards/ Laminates
  • ISIN: INE461C01038
  • NSEID: GREENPLY
  • BSEID: 526797
INR
285.25
-1.95 (-0.68%)
BSENSE

Aug 07, 03:30 PM

BSE+NSE Vol: 62.28 k

  • Price Points
  • Score
  • Mojo Parameters
  • Total Return
  • News and Corporate Actions
  • Key factors
  • Shareholding
  • Financials
  • CompanyCV
stock-summaryPrice Point
High/Low

1Day

52 Week

Valuation
Technical
Day's Volume

CASH

62.28 k (-77.33%) Volume

Shareholding (Jun 2026)

FII

4.44%

Held by 47 FIIs

DII

31.42%

Held by 35 DIIs

Promoter

51.93%

Why is Greenply Industries Ltd falling/rising?

07-Aug-2026

As of 06-Aug, Greenply Industries Ltd's stock price is at Rs 287.20, down 2.13% after a trend reversal. Despite a year-to-date gain of 6.83%, the stock has underperformed recently, with a 9.60% decline over the past month and negative short-term momentum.

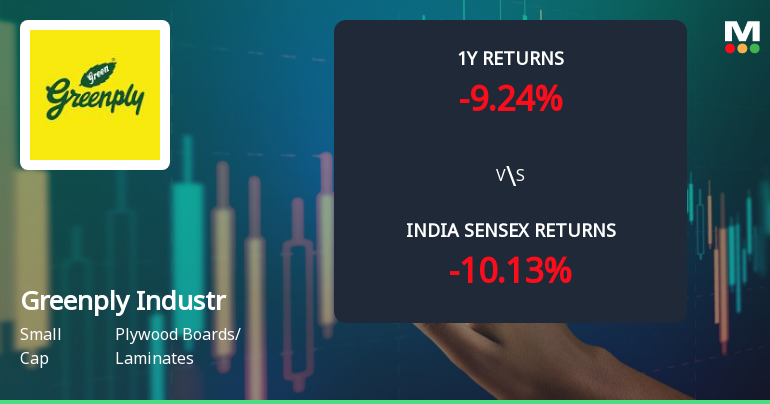
As of 06-Aug, Greenply Industries Ltd's stock price is falling, currently at Rs 287.20, reflecting a decrease of Rs 6.25 or 2.13%. This decline follows a trend reversal after four consecutive days of gains. The stock has underperformed its sector by 2.51% today and reached an intraday low of Rs 285.35, which is a 2.76% drop.<BR><BR>In terms of performance over different periods, the stock has seen a significant decline of 9.60% over the past month, while the benchmark Sensex has increased by 0.86%. Year-to-date, however, the stock has shown a positive return of 6.83%, contrasting with the Sensex's decline of 7.35%. Over the last year, the stock has decreased by 5.04%, while the Sensex has only fallen by 1.97%. <BR><BR>Despite positive factors such as a 20.65% growth in net sales and strong quarterly results, the stock's recent performance indicates a lack of momentum, particularly in the short term. The moving averages suggest that while the stock is above the 5-day, 100-day, and 200-day averages, it is below the 20-day and 50-day averages, indicating potential weakness in the stock's price trend. <BR><BR>Additionally, while there has been a rise in investor participation, with delivery volume increasing significantly, the overall sentiment appears to be negative, contributing to the stock's current decline.

View full answer

Are Greenply Industries Ltd latest results good or bad?

25-Jul-2026

Greenply Industries Ltd's latest results show a 32.02% increase in net profit and a 20.65% rise in net sales, indicating strong demand. However, a decline in operating margins raises concerns about profitability, leading to a negative market reaction.

Greenply Industries Ltd's latest results present a mixed picture. On the positive side, the company reported a consolidated net profit of ₹37.52 crore, which is a significant increase of 32.02% year-on-year. Additionally, net sales reached ₹724.89 crore, reflecting a robust year-on-year growth of 20.65%. This indicates strong demand and potential market share gains.<BR><BR>However, there are some concerns regarding profitability. The operating margin (excluding other income) decreased to 10.80%, down 121 basis points from the previous quarter, which raises questions about cost management in the current inflationary environment. Despite the profit growth, the market reacted negatively to these margin pressures, leading to a decline in the stock price post-results.<BR><BR>Overall, while the revenue and profit growth are encouraging, the sequential decline in operating margins suggests that the company faces challenges in maintaining profitability. Investors should weigh these factors carefully when assessing the company's performance.

View full answer

Should I buy, sell or hold Greenply Industries Ltd?

25-Jul-2026

How big is Greenply Industr?

11-Jun-2026

As of 10th June, Greenply Industries Ltd has a market capitalization of 3,591.00 Cr, with recent net sales of 2,739.03 Cr and a net profit of 89.52 Cr over the last four quarters.

As of 10th June, <BR><BR>Market Cap: Greenply Industries Ltd has a market capitalization of 3,591.00 Cr, categorizing it as a Small Cap company.<BR><BR>Recent Quarterly Performance: The sum of Net Sales for the latest 4 quarters is 2,739.03 Cr, while the sum of Net Profit for the same period is 89.52 Cr.<BR><BR>Balance Sheet Snapshot: The reporting period for the latest annual data is March 2025. Shareholder's Funds are valued at 808.64 Cr, and Total Assets amount to 1,942.62 Cr.

View full answer

Who are in the management team of Greenply Industr?

11-Jun-2026

The management team of Greenply Industries includes Rajesh Mittal (Chairman), Manoj Tulsian and Sanidhya Mittal (Joint Managing Directors), and several independent directors: S K Pal, Vinod Kothari, Sonali Bhagwati Dalal, Upendra Nath Challu, and Vinita Bajoria. They are responsible for the company's strategic direction and operations.

The management team of Greenply Industries includes the following members:<BR><BR>1. **Rajesh Mittal** - Chairman / Executive Director<BR>2. **Manoj Tulsian** - Executive Director / Joint Managing Director / Non-Promoter<BR>3. **Sanidhya Mittal** - Executive Director / Joint Managing Director / Promoter<BR>4. **S K Pal** - Independent Non-Executive Director<BR>5. **Vinod Kothari** - Independent Non-Executive Director<BR>6. **Sonali Bhagwati Dalal** - Independent Non-Executive Director<BR>7. **Upendra Nath Challu** - Independent Non-Executive Director<BR>8. **Vinita Bajoria** - Independent Non-Executive Director<BR><BR>This team plays a crucial role in guiding the company's strategic direction and operations.

View full answer

Who are the peers of the Greenply Industr?

11-Jun-2026

Greenply Industr's peers include Century Plyboard, Greenlam Industr, Stylam Industrie, and others. Management risk varies from excellent to below average among peers, with Stylam Industrie showing the highest 1-year return at 80.17% and Greenply Industr at -6.64%.

Peers: The peers of Greenply Industr are Century Plyboard, Greenlam Industr, Stylam Industrie, Greenpanel Inds., Rushil Decor, Archidply Inds., Ecoboard Inds., Duroply Indust., and Airo Lam.<BR><BR>Quality Snapshot: Excellent management risk is observed at Century Plyboard, Greenlam Industr, Stylam Industrie, and Greenpanel Inds., while Average management risk is found at Greenply Industr and Rushil Decor. Below Average management risk is noted for Archidply Inds., Ecoboard Inds., Duroply Indust., and Airo Lam. Growth is rated as Good for Century Plyboard and Duroply Indust., Average for Stylam Industrie, and Below Average for Greenlam Industr, Greenply Industr, Greenpanel Inds., Rushil Decor, Archidply Inds., Ecoboard Inds., and Airo Lam. Capital Structure is Excellent for Century Plyboard, Stylam Industrie, and Greenpanel Inds., Average for Greenlam Industr and Greenply Industr, and Below Average for Rushil Decor, Archidply Inds., Ecoboard Inds., Duroply Indust., and Airo Lam.<BR><BR>Return Snapshot: Stylam Industrie has the highest 1-year return at 80.17%, while Rushil Decor has the lowest at -52.26%. Greenply Industr's 1-year return is -6.64%, which is higher than Rushil Decor's but lower than Stylam Industrie’s. Additionally, the six-month returns are negative for Rushil Decor, Archidply Inds., Duroply Indust., and Airo Lam.

View full answer

What does Greenply Industr do?

10-Jun-2026

Greenply Industries Ltd manufactures plywood, MDF, and related products, operating in the small-cap plywood and laminates sector. As of March 2026, it reported net sales of ₹776 Cr and a net profit of ₹31 Cr, with a market cap of ₹3,591 Cr.

Overview: <BR>Greenply Industries Ltd is primarily involved in the manufacturing of plywood, medium density fibre boards (MDF), and trading of wallcovers and allied products, operating in the plywood boards/laminates industry within the small-cap market segment.<BR><BR>History: <BR>Incorporated in 1990, Greenply Industries Ltd has established itself as a significant player in its sector. The latest quarterly results reported net sales and net profit for the period ending March 2026.<BR><BR>Financial Snapshot: <BR>Net Sales: 776 Cr (Quarterly Results - Mar 2026) <BR>Net Profit: 31 Cr (Quarterly Results - Mar 2026) <BR>Market Cap: INR 3,591 Cr (Small Cap)<BR><BR>Key Metrics: <BR>P/E: 36.00 <BR>Industry P/E: 53 <BR>Dividend Yield: 0.17% <BR>Debt-Equity: 0.54 <BR>Return on Equity: 11.09% <BR>Price to Book: 4.03<BR><BR>Contact Details: <BR>Address: Makum Road, PB No 14 Tinsukia Assam : 786125 <BR>Tel: 91-033-30515000 <BR>Email: investors@greenply.com <BR>Website: http://www.greenply.com

View full answer

When is the next results date for Greenply Industries Ltd?

24-Apr-2026

The next results date for Greenply Industries Ltd is April 28, 2026.

The next results date for Greenply Industries Ltd is scheduled for April 28, 2026.

View full answer

Is Greenply Industr technically bullish or bearish?

29-Nov-2025

As of November 28, 2025, the technical trend has shifted to a moderate bearish stance, indicated by bearish MACD, Bollinger Bands, moving averages, and underperformance against the Sensex.

As of 28 November 2025, the technical trend has changed from mildly bearish to bearish. The current stance is bearish with a moderate strength. Key indicators driving this include a bearish MACD on the weekly chart, bearish Bollinger Bands on both weekly and monthly time frames, and bearish moving averages on the daily chart. Additionally, the KST is bearish on the weekly and mildly bearish on the monthly, while the Dow Theory indicates a mildly bearish stance on the weekly and monthly. The stock has underperformed significantly against the Sensex over the past year and month, further supporting the bearish outlook.

View full answer

How has been the historical performance of Greenply Industr?

28-Nov-2025

Greenply Industries has shown consistent growth in net sales and profits, with net sales increasing from 1,165.34 Cr in Mar'21 to 2,487.58 Cr in Mar'25, and operating profit rising from 123.47 Cr to 254.15 Cr in the same period, despite slight fluctuations in profit after tax. Total assets and liabilities have also grown significantly, reflecting the company's resilience and overall positive financial performance.

Answer:<BR>The historical performance of Greenply Industries shows a consistent growth trajectory in net sales and profits over the years, with notable fluctuations in certain metrics.<BR><BR>Breakdown:<BR>Greenply Industries has demonstrated significant growth in net sales, increasing from 1,165.34 Cr in Mar'21 to 2,487.58 Cr in Mar'25. This upward trend is reflected in total operating income, which rose from 1,165.34 Cr in Mar'21 to 2,487.58 Cr in Mar'25. The company has also seen a rise in operating profit, which increased from 123.47 Cr in Mar'21 to 254.15 Cr in Mar'25, although the operating profit margin has slightly declined from 10.01% in Mar'21 to 9.55% in Mar'25. Profit before tax has shown a positive trend, reaching 150.92 Cr in Mar'25, up from 83.75 Cr in Mar'21. However, profit after tax has fluctuated, peaking at 126.76 Cr in Mar'23 before settling at 125.64 Cr in Mar'25. The company's total assets have grown from 908.74 Cr in Mar'21 to 1,942.62 Cr in Mar'25, while total liabilities have also increased, reflecting a rise from 908.74 Cr in Mar'21 to 1,942.62 Cr in Mar'25. Cash flow from operating activities improved significantly to 218.00 Cr in Mar'25 from 62.00 Cr in Mar'23, although the net cash flow showed a slight outflow of 11.00 Cr in Mar'25. Overall, Greenply Industries has shown resilience and growth in its financial performance over the years.

View full answer

Is Greenply Industr overvalued or undervalued?

07-Nov-2025

As of November 6, 2025, Greenply Industries is rated very attractive and undervalued, with a PE Ratio of 44.41, an EV to EBITDA of 22.90, and a Price to Book Value of 0.43, indicating it is more attractively priced than peers like Century Plyboard, despite a recent 1-year stock return of -20.93% compared to the Sensex's 3.65%, while maintaining a strong long-term outlook with a 5-year return of 229.92%.

As of 6 November 2025, the valuation grade for Greenply Industries has moved from attractive to very attractive, indicating a significant positive shift in its perceived value. The company is currently considered undervalued. Key ratios include a PE Ratio of 44.41, an EV to EBITDA of 22.90, and a Price to Book Value of 0.43, which suggest that the stock is trading at a lower valuation compared to its earnings and book value.<BR><BR>In comparison to peers, Greenply Industries stands out with a PE Ratio of 44.41, while Century Plyboard has a much higher PE of 82.46, indicating that Greenply is more attractively priced relative to its earnings. Greenpanel Industries, also rated very attractive, has a significantly lower EV to EBITDA of 14.09, further supporting the notion that Greenply is undervalued in its sector. Despite recent underperformance with a 1-year stock return of -20.93% compared to the Sensex's 3.65%, the long-term outlook remains positive with a 5-year stock return of 229.92%, suggesting potential for recovery and growth.

View full answer

Who are the top shareholders of the Greenply Industr?

17-Jul-2025

The top shareholders of Greenply Industries include Shakuntala Safeinvest Private Limited with 37.35%, mutual funds holding 29.71%, and individual investors at 8.5%. Notably, Mirae Asset Elss Tax Saver Fund is the largest public shareholder at 9.87%, with no pledged promoter holdings reported.

The top shareholders of Greenply Industries include a mix of promoters, mutual funds, and individual investors. The largest promoter is Shakuntala Safeinvest Private Limited, which holds 37.35% of the shares. Mutual funds collectively hold 29.71% through 13 different schemes, with Mirae Asset Elss Tax Saver Fund being the highest public shareholder at 9.87%. Additionally, foreign institutional investors (FIIs) hold 5.42%, while individual investors account for 8.5% of the shareholding. There are no pledged promoter holdings reported.

View full answer

Has Greenply Industr declared dividend?

06-Jun-2025

Greenply Industries Ltd has declared a 50% dividend, amounting to ₹0.5 per share, with an ex-date of August 5, 2024. While the last 6 months showed a total return of -6.54%, longer-term returns over 1 to 5 years have been significantly positive, particularly with a total return of 268.25% over the last 5 years.

Greenply Industries Ltd has declared a 50% dividend.<BR><BR>Dividend Details:<BR>- Percentage announced: 50%<BR>- Amount per share: 0.5<BR>- Ex-date: 05 Aug 24<BR><BR>Dividend Yield: 0.16%.<BR><BR>Total Returns by Period:<BR>In the last 6 months, the price return was -6.54%, with a dividend return of 0%, resulting in a total return of -6.54%.<BR><BR>Over the past year, the price return was 15.95%, the dividend return was 0.17%, leading to a total return of 16.12%.<BR><BR>In the 2-year period, the price return was 90.09%, with a dividend return of 0.57%, culminating in a total return of 90.66%.<BR><BR>For the 3-year period, the price return was 74.17%, the dividend return was 0.87%, which resulted in a total return of 75.04%.<BR><BR>In the 4-year period, the price return was 52.73%, with a dividend return of 0.93%, giving a total return of 53.66%.<BR><BR>Finally, over the last 5 years, the price return was 265.65%, the dividend return was 2.60%, leading to a total return of 268.25%.<BR><BR>Overall, Greenply Industries Ltd has declared a dividend, and while the recent performance over the last 6 months has been negative, the longer-term returns over 1 to 5 years show significant positive growth, particularly in price returns.

View full answer
iScoreScore
Part of MojoOne Strategy
Click here to find our call on this stock
Strong Sell
Sell
Hold
Buy
Strong Buy

Dashboard

1

With a growth in Net Sales of 20.65%, the company declared Very Positive results in Jun 26

  • The company has declared positive results for the last 2 consecutive quarters
  • OPERATING PROFIT TO INTEREST(Q) Highest at 10.45 times
  • PBT LESS OI(Q) At Rs 47.64 cr has Grown at 156.40%
  • PAT(Q) At Rs 37.52 cr has Grown at 50.5%
2

With ROCE of 14.9, it has a Attractive valuation with a 2.9 Enterprise value to Capital Employed

3

High Institutional Holdings at 35.87%

stock-summaryMojo Parameters

Mojo Parameters

Loading Valuation Snapshot...

Stock DNA

stock-summary
Industry

Plywood Boards/ Laminates

stock-summary
Market cap

INR 3,586 Cr (Small Cap)

stock-summary
P/E

32.00

stock-summary
Industry P/E

58

stock-summary
Dividend Yield

0.17%

stock-summary
Debt Equity

0.54

stock-summary
Return on Equity

11.09%

stock-summary
Price to Book

4.04

Revenue and Profits:
Net Sales:
725 Cr
(Quarterly Results - Jun 2026)
Net Profit:
38 Cr
stock-summaryTotal Returns
Total Returns (Price + Dividend) stock-summary
Dividend Yield (0.17%)
TimePeriod
Price Return
Dividend Return
Total Return
3 Months
6.84%
0.19%
7.03%
6 Months
24.81%
0.21%
25.02%
1 Year
-8.25%
0.16%
-8.09%
2 Years
-24.85%
0.27%
-24.58%
3 Years
69.94%
0.90%
70.84%
4 Years
56.39%
1.09%
57.48%
5 Years
51.89%
1.40%
53.29%

Latest dividend: 0.5013063926145271 per share ex-dividend date: Aug-04-2026

Risk Adjusted Returns v/s stock-summary
Returns Beta
Icon
Beta has not been calculated since enough price history is not available
stock-summaryNews & Corporate Actions

News

Announcements stock-summary

Announcement under Regulation 30 (LODR)-Newspaper Publication

06-Aug-2026 | Source : BSE

Please find attached Newspaper clipping of the public notice in respect of transfer of equity shares of the company to IEPF Demat Account

Announcement under Regulation 30 (LODR)-Newspaper Publication

04-Aug-2026 | Source : BSE

Newspaper Publication- Public Notice to the Shareholders regarding opening of Special Window for Transfer and Dematerialization of Physical Shares of Greenply Industries Limited

Letter To Shareholder Containing Weblink And Exact Path For Accessing Annual Report And Notice Of 36Th AGM

01-Aug-2026 | Source : BSE

Please find letter to Shareholders containing weblink for accessing Annual Report and Notice of 36th AGM

Corporate Actions stock-summary

stock-summary
BOARD MEETING

No Upcoming Board Meetings

stock-summary
DIVIDEND

Greenply Industries Ltd has declared 50% dividend, ex-date: 04 Aug 26

stock-summary
SPLITS

Greenply Industries Ltd has announced 1:5 stock split, ex-date: 06 Jan 16

stock-summary
BONUS

No Bonus history available

stock-summary
RIGHTS

Greenply Industries Ltd has announced 3:10 rights issue, ex-date: 07 Sep 09

stock-summaryKey Factors

Quality key factors stock-summary

Factor
Value
Sales Growth (5y)
17.23%
EBIT Growth (5y)
15.21%
EBIT to Interest (avg)
5.37
Debt to EBITDA (avg)
2.67
Net Debt to Equity (avg)
0.54
Sales to Capital Employed (avg)
1.77
Tax Ratio
28.58%
Dividend Payout Ratio
6.81%
Pledged Shares
0
Institutional Holding
35.87%
ROCE (avg)
13.72%
ROE (avg)
12.55%

Valuation key factors

Factor
Value
P/E Ratio
32
Industry P/E
58
Price to Book Value
3.98
EV to EBIT
18.35
EV to EBITDA
14.09
EV to Capital Employed
2.93
EV to Sales
1.41
PEG Ratio
0.94
Dividend Yield
0.18%
ROCE (Latest)
14.90%
ROE (Latest)
11.09%

Technicals key factors

Indicator
Weekly
Monthly
MACD
Bullish
Bullish
RSI
No Signal
No Signal
Bollinger Bands
Mildly Bullish
Mildly Bullish
Moving Averages
Mildly Bullish (Daily)
KST
Bullish
Bearish
Dow Theory
No Trend
No Trend
OBV
Mildly Bearish
No Trend
stock-summary Technical Indicator Scale: Bearish, Mildly Bearish, Sideways, Mildly Bullish, Bullish  Turned 
stock-summaryShareholding
Shareholding Snapshot : Jun 2026stock-summary
Shareholding Compare (%holding) stock-summary
Majority shareholders

Promoters

Pledged Promoter Holdings

None

Mutual Funds

Held by 10 Schemes (30.2%)

FIIs

Held by 47 FIIs (4.44%)

Promoter with highest holding

Shakuntala Safeinvest Private Limited (formerly Known As Showan Investment Private Limited) (37.46%)

Highest Public shareholder

Mirae Asset Elss Tax Saver Fund (9.92%)

Individual Investors Holdings

9.66%

stock-summaryFinancial
[
  {
    "link": "quarterly",
    "btn_text": "All Quarterly Results",
    "header": "Quarterly Results Snapshot (Consolidated) - Jun'26 - YoY",
    "rhs": [
      {
        "prefix": "Net Sales ",
        "suffix": "YoY Growth in quarter ended Jun 2026 is 20.65% vs 2.90% in Jun 2025",
        "dir": 1
      },
      {
        "prefix": "Consolidated Net Profit ",
        "suffix": "YoY Growth in quarter ended Jun 2026 is 32.02% vs -14.06% in Jun 2025",
        "dir": 1
      }
    ],
    "table": {
      "header": [
        "Jun'26",
        "Jun'25",
        "Change(%)"
      ],
      "body": [
        {
          "field": "Net Sales",
          "val1": "724.89",
          "val2": "600.81",
          "chgp": "20.65%",
          "chgp_class": "positive"
        },
        {
          "field": "Operating Profit (PBDIT) excl Other Income",
          "val1": "78.30",
          "val2": "61.60",
          "chgp": "27.11%",
          "chgp_class": "positive"
        },
        {
          "field": "Interest",
          "val1": "7.49",
          "val2": "18.51",
          "chgp": "-59.54%",
          "chgp_class": "positive"
        },
        {
          "field": "Exceptional Items",
          "val1": "0.00",
          "val2": "4.43",
          "chgp": "-100.00%",
          "chgp_class": "negative"
        },
        {
          "field": "Consolidate Net Profit",
          "val1": "37.52",
          "val2": "28.42",
          "chgp": "32.02%",
          "chgp_class": "positive"
        },
        {
          "field": "Operating Profit Margin (Excl OI)",
          "val1": "10.80%",
          "val2": "10.25%",
          "chgp": "0.55%",
          "chgp_class": "positive"
        }
      ]
    }
  },
  {
    "link": "half-yearly",
    "btn_text": "All Half Yearly Results",
    "header": "Half Yearly Results Snapshot (Consolidated) - Sep'25",
    "rhs": [
      {
        "prefix": "Net Sales ",
        "suffix": " Growth in half year ended Sep 2025 is 5.31% vs 22.68% in Sep 2024",
        "dir": -1
      },
      {
        "prefix": "Consolidated Net Profit ",
        "suffix": " Growth in half year ended Sep 2025 is -12.29% vs 244.36% in Sep 2024",
        "dir": -1
      }
    ],
    "table": {
      "header": [
        "Sep'25",
        "Sep'24",
        "Change(%)"
      ],
      "body": [
        {
          "field": "Net Sales",
          "val1": "1,289.39",
          "val2": "1,224.36",
          "chgp": "5.31%",
          "chgp_class": "positive"
        },
        {
          "field": "Operating Profit (PBDIT) excl Other Income",
          "val1": "118.37",
          "val2": "115.54",
          "chgp": "2.45%",
          "chgp_class": "positive"
        },
        {
          "field": "Interest",
          "val1": "32.00",
          "val2": "24.87",
          "chgp": "28.67%",
          "chgp_class": "negative"
        },
        {
          "field": "Exceptional Items",
          "val1": "4.43",
          "val2": "0.00",
          "chgp": "",
          "chgp_class": "neutral"
        },
        {
          "field": "Consolidate Net Profit",
          "val1": "44.46",
          "val2": "50.69",
          "chgp": "-12.29%",
          "chgp_class": "negative"
        },
        {
          "field": "Operating Profit Margin (Excl OI)",
          "val1": "9.18%",
          "val2": "9.44%",
          "chgp": "-0.26%",
          "chgp_class": "negative"
        }
      ]
    }
  },
  {
    "link": "nine-monthly",
    "btn_text": "All Nine Monthly Results",
    "header": "Nine Monthly Results Snapshot (Consolidated) - Dec'25",
    "rhs": [
      {
        "prefix": "Net Sales ",
        "suffix": "YoY Growth in nine months ended Dec 2025 is 6.74% vs 16.37% in Dec 2024",
        "dir": -1
      },
      {
        "prefix": "Consolidated Net Profit ",
        "suffix": "YoY Growth in nine months ended Dec 2025 is -21.72% vs 80.69% in Dec 2024",
        "dir": -1
      }
    ],
    "table": {
      "header": [
        "Dec'25",
        "Dec'24",
        "Change(%)"
      ],
      "body": [
        {
          "field": "Net Sales",
          "val1": "1,962.79",
          "val2": "1,838.81",
          "chgp": "6.74%",
          "chgp_class": "positive"
        },
        {
          "field": "Operating Profit (PBDIT) excl Other Income",
          "val1": "177.28",
          "val2": "169.57",
          "chgp": "4.55%",
          "chgp_class": "positive"
        },
        {
          "field": "Interest",
          "val1": "41.82",
          "val2": "29.97",
          "chgp": "39.54%",
          "chgp_class": "negative"
        },
        {
          "field": "Exceptional Items",
          "val1": "0.58",
          "val2": "0.00",
          "chgp": "",
          "chgp_class": "neutral"
        },
        {
          "field": "Consolidate Net Profit",
          "val1": "58.83",
          "val2": "75.15",
          "chgp": "-21.72%",
          "chgp_class": "negative"
        },
        {
          "field": "Operating Profit Margin (Excl OI)",
          "val1": "9.03%",
          "val2": "9.22%",
          "chgp": "-0.19%",
          "chgp_class": "negative"
        }
      ]
    }
  },
  {
    "link": "annual",
    "btn_text": "All Annual Results",
    "header": "Annual Results Snapshot (Consolidated) - Mar'26",
    "rhs": [
      {
        "prefix": "Net Sales ",
        "suffix": "YoY Growth in year ended Mar 2026 is 10.11% vs 14.11% in Mar 2025",
        "dir": -1
      },
      {
        "prefix": "Consolidated Net Profit ",
        "suffix": "YoY Growth in year ended Mar 2026 is -2.29% vs 30.97% in Mar 2025",
        "dir": -1
      }
    ],
    "table": {
      "header": [
        "Mar'26",
        "Mar'25",
        "Change(%)"
      ],
      "body": [
        {
          "field": "Net Sales",
          "val1": "2,739.04",
          "val2": "2,487.58",
          "chgp": "10.11%",
          "chgp_class": "positive"
        },
        {
          "field": "Operating Profit (PBDIT) excl Other Income",
          "val1": "270.53",
          "val2": "237.66",
          "chgp": "13.83%",
          "chgp_class": "positive"
        },
        {
          "field": "Interest",
          "val1": "55.26",
          "val2": "43.09",
          "chgp": "28.24%",
          "chgp_class": "negative"
        },
        {
          "field": "Exceptional Items",
          "val1": "-14.57",
          "val2": "0.00",
          "chgp": "",
          "chgp_class": "neutral"
        },
        {
          "field": "Consolidate Net Profit",
          "val1": "89.53",
          "val2": "91.63",
          "chgp": "-2.29%",
          "chgp_class": "negative"
        },
        {
          "field": "Operating Profit Margin (Excl OI)",
          "val1": "9.88%",
          "val2": "9.55%",
          "chgp": "0.33%",
          "chgp_class": "positive"
        }
      ]
    }
  }
]

Quarterly Results Snapshot (Consolidated) - Jun'26 - YoYstock-summary

Jun'26
Jun'25
Change(%)
Net Sales
724.89
600.81
20.65%
Operating Profit (PBDIT) excl Other Income
78.30
61.60
27.11%
Interest
7.49
18.51
-59.54%
Exceptional Items
0.00
4.43
-100.00%
Consolidate Net Profit
37.52
28.42
32.02%
Operating Profit Margin (Excl OI)
10.80%
10.25%
0.55%
Values in Rs Cr.
Direction Arrows
Net Sales

YoY Growth in quarter ended Jun 2026 is 20.65% vs 2.90% in Jun 2025

Direction Arrows
Consolidated Net Profit

YoY Growth in quarter ended Jun 2026 is 32.02% vs -14.06% in Jun 2025

Half Yearly Results Snapshot (Consolidated) - Sep'25stock-summary

Sep'25
Sep'24
Change(%)
Net Sales
1,289.39
1,224.36
5.31%
Operating Profit (PBDIT) excl Other Income
118.37
115.54
2.45%
Interest
32.00
24.87
28.67%
Exceptional Items
4.43
0.00
Consolidate Net Profit
44.46
50.69
-12.29%
Operating Profit Margin (Excl OI)
9.18%
9.44%
-0.26%
Values in Rs Cr.
Direction Arrows
Net Sales

Growth in half year ended Sep 2025 is 5.31% vs 22.68% in Sep 2024

Direction Arrows
Consolidated Net Profit

Growth in half year ended Sep 2025 is -12.29% vs 244.36% in Sep 2024

Nine Monthly Results Snapshot (Consolidated) - Dec'25stock-summary

Dec'25
Dec'24
Change(%)
Net Sales
1,962.79
1,838.81
6.74%
Operating Profit (PBDIT) excl Other Income
177.28
169.57
4.55%
Interest
41.82
29.97
39.54%
Exceptional Items
0.58
0.00
Consolidate Net Profit
58.83
75.15
-21.72%
Operating Profit Margin (Excl OI)
9.03%
9.22%
-0.19%
Values in Rs Cr.
Direction Arrows
Net Sales

YoY Growth in nine months ended Dec 2025 is 6.74% vs 16.37% in Dec 2024

Direction Arrows
Consolidated Net Profit

YoY Growth in nine months ended Dec 2025 is -21.72% vs 80.69% in Dec 2024

Annual Results Snapshot (Consolidated) - Mar'26stock-summary

Mar'26
Mar'25
Change(%)
Net Sales
2,739.04
2,487.58
10.11%
Operating Profit (PBDIT) excl Other Income
270.53
237.66
13.83%
Interest
55.26
43.09
28.24%
Exceptional Items
-14.57
0.00
Consolidate Net Profit
89.53
91.63
-2.29%
Operating Profit Margin (Excl OI)
9.88%
9.55%
0.33%
Values in Rs Cr.
Direction Arrows
Net Sales

YoY Growth in year ended Mar 2026 is 10.11% vs 14.11% in Mar 2025

Direction Arrows
Consolidated Net Profit

YoY Growth in year ended Mar 2026 is -2.29% vs 30.97% in Mar 2025

stock-summaryCompany CV
About Greenply Industries Ltd stock-summary
stock-summary
Greenply Industries Ltd
Small Cap
Plywood Boards/ Laminates
Greenply Industries Limited, incorporated in 1990, is primarily involved in manufacturing of plywood, medium density fibre boards (MDF) and trading of wallcovers and allied products. Greenply is the first company of its kind in India to introduce a lifetime guarantee in its premium plywood products, Green Club and Green Club Plus Plywood. Greenply Industries has three overseas subsidies viz. Greenply Trading Pte. Limited, Greenply Holdings Pte.
Company Coordinates stock-summary
Company Details
Makum Road, PB No 14 Tinsukia Assam : 786125
stock-summary
Tel: 91-033-30515000
stock-summary
investors@greenply.com
Registrar Details
SK Computers, 34/1A, Sudhir Chatterjee Street, Kolkata West Bengal , 34/1A, Sudhir Chatterjee Street, Kolkata