
Key Events This Week
8 Jun: New 52-week high (Rs.147.55)
9 Jun: All-time high reached (Rs.152.25)
10 Jun: Golden Cross formation signals bullish breakout
12 Jun: Week closes at Rs.145.50 (+1.50%)
Jun 15, 01:36 PM
BSE+NSE Vol: 1.11 lacs
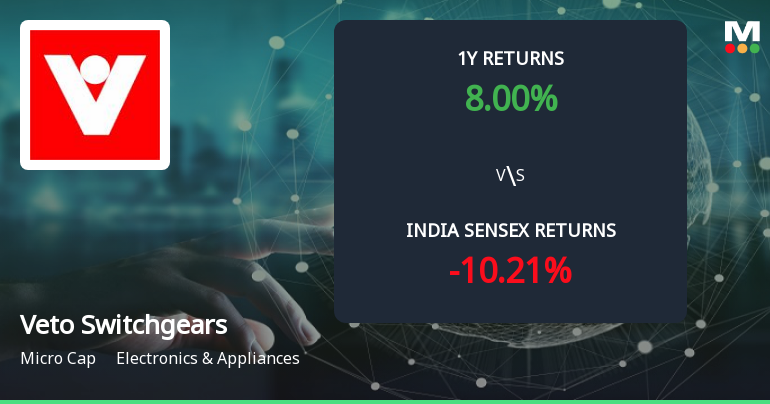
Electronics & Appliances
INR 277 Cr (Micro Cap)
11.00
48
0.69%
0.07
8.67%
0.96
Latest dividend: 1 per share ex-dividend date: Sep-22-2025


Veto Switchgears & Cables Ltd is rated Buy by MarketsMOJO. This rating was last updated on 30 May 2026, reflecting a positive reassessment of the stock’s prospects. However, all fundamentals, returns, and financial metrics discussed below are current as of 15 June 2026, providing investors with the latest view on the company’s performance and outlook.
Read full news article
8 Jun: New 52-week high (Rs.147.55)
9 Jun: All-time high reached (Rs.152.25)
10 Jun: Golden Cross formation signals bullish breakout
12 Jun: Week closes at Rs.145.50 (+1.50%)
The 50-day moving average has crossed above the 200-day moving average for Veto Switchgears & Cables Ltd on 10 Jun 2026, signalling a golden cross. Yet, the stock declined 2.96% on the same day, while monthly technical indicators remain only mildly bullish, creating a nuanced picture that demands closer examination.
Read full news articlePursuant to Regulation 30 of the SEBI (LODR) Regulations2015 we herby inform you that Mr. Kanishk Kishore Gurnani (Promoter/Shareholder) has transferred 175000 equity shares of Veto Switchgears and Cables Limited to Mrs. Priyanka Kishore Gurnani (Promoter/ shareholder) by way of gift on 1st day of June 2026 at 4.15 P.M.
In compliance with the provisions of Regulation 47 of SEBI (Listing Obligations and Disclosure Requirements) Regulation 2015 read with corresponding circulars and notifications issued thereunder we are pleased to enclose copies of Business Standard & Mumbai Lakshadweep editions of both dated 30th May 2026 have been published. The aforesaid results have been approved by Board of Directors in its meeting held on 28.05.2026
Pursuant to the Regulation 30 of SEBI (LODR) Regulations 2015 the Board of directors of the company in their meeting held today i.e. on 28th may 2026 has considered and approved the reaapointment of Cost auditor & Internal Auditor of the company for the F.Y 2026-27.

No Upcoming Board Meetings

Veto Switchgears & Cables Ltd has declared 10% dividend, ex-date: 22 Sep 25

No Splits history available

Veto Switchgears & Cables Ltd has announced 1:10 bonus issue, ex-date: 06 Sep 13

No Rights history available
 Technical Indicator Scale: Bearish, Mildly Bearish, Sideways, Mildly Bullish, Bullish Turned
 Non Institution
None
Held by 0 Schemes
Held by 1 FIIs (0.01%)
Veto Electropowers (india) Private Limited (32.28%)
Dheeraj Kumar Lohia (1.43%)
48.07%

YoY Growth in quarter ended Mar 2026 is 55.71% vs 12.26% in Mar 2025

YoY Growth in quarter ended Mar 2026 is 16.45% vs 255.66% in Mar 2025
Growth in half year ended Sep 2025 is 13.40% vs -2.25% in Sep 2024
Growth in half year ended Sep 2025 is -10.05% vs -0.18% in Sep 2024
YoY Growth in nine months ended Dec 2025 is 17.36% vs -4.29% in Dec 2024
YoY Growth in nine months ended Dec 2025 is 12.06% vs -6.77% in Dec 2024
YoY Growth in year ended Mar 2026 is 28.74% vs 0.10% in Mar 2025
YoY Growth in year ended Mar 2026 is 13.56% vs 23.29% in Mar 2025


