Veto Switchgears

  • Market Cap: Micro Cap
  • Industry: Electronics & Appliances
  • ISIN: INE918N01018
  • NSEID: VETO
  • BSEID: 539331
INR
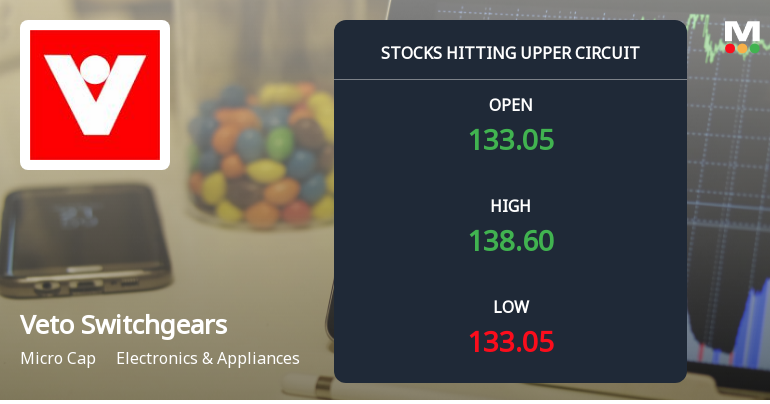
138.60
6.6 (5.0%)
BSENSE

Sep 18, 03:30 PM

BSE+NSE Vol: 2.0 lacs

  • Price Points
  • Score
  • Mojo Parameters
  • Total Return
  • News and Corporate Actions
  • Key factors
  • Shareholding
  • Financials
  • CompanyCV
stock-summaryPrice Point
High/Low

1Day

52 Week

Valuation
Technical
Day's Volume

CASH

2.0 lacs (173.84%) Volume

Shareholding (Jun 2026)

FII

0.41%

Held by 3 FIIs

DII

0.00%

Held by 0 DIIs

Promoter

45.06%

Which are the latest news on Veto Switchgears?

18-Sep-2026

Why is Veto Switchgears & Cables Ltd falling/rising?

06-Sep-2026

As of 05-Sep, Veto Switchgears & Cables Ltd is experiencing a slight decline in its stock price to 127.95, but it has shown strong performance with a year-to-date gain of 11.55% and increased investor interest, despite a minor drop today. The stock continues to trade above its moving averages, indicating a positive overall trend.

As of 05-Sep, Veto Switchgears & Cables Ltd is experiencing a slight decline in its stock price, currently at 127.95, which reflects a change of -0.1 (-0.08%). Despite this minor drop, the stock has shown strong performance over various periods. For instance, in the last week, it has increased by 1.11%, while over the past month, it has risen by 4.28%. Year-to-date, the stock has gained 11.55%, significantly outperforming the Sensex, which has decreased by 10.21% in the same timeframe.<BR><BR>Today's performance indicates that Veto Switchgears has outperformed its sector by 2.81%, and it has been on a consecutive gain streak for the last four days, accumulating a total return of 3.81% during this period. Furthermore, the stock is trading above its moving averages across multiple timeframes, including the 5-day, 20-day, 50-day, 100-day, and 200-day averages, suggesting a strong upward trend in its price.<BR><BR>Additionally, there has been a notable increase in investor participation, with delivery volume rising by 72.94% compared to the 5-day average, indicating heightened interest in the stock. However, it is important to note that the cable sector overall has faced a decline of 2.54%, which may be influencing the stock's current price movement. Despite the slight decrease today, the overall trend and performance metrics suggest a generally positive outlook for Veto Switchgears & Cables Ltd.

View full answer

Who are in the management team of Veto Switchgears?

01-Sep-2026

The management team of Veto Switchgears includes Akshay Kumar Gurnani (Managing Director & CEO), Narain Das Gurnani (Whole Time Director & CFO), Jyoti Gurnani (Director), and Varsha Ranee Choudhary (Company Secretary & Compliance Officer), along with independent directors Govind Ram Thawani, Kanwarjeet Singh, Hari Krishan Motwani, and Sanjeev Kumar Dass. This team oversees the company's operations and governance.

The management team of Veto Switchgears includes the following key individuals:<BR><BR>1. **Akshay Kumar Gurnani** - Managing Director & CEO<BR>2. **Narain Das Gurnani** - Whole Time Director & CFO<BR>3. **Jyoti Gurnani** - Director<BR>4. **Varsha Ranee Choudhary** - Company Secretary & Compliance Officer<BR><BR>Additionally, the board features several independent directors:<BR>- **Govind Ram Thawani**<BR>- **Kanwarjeet Singh**<BR>- **Hari Krishan Motwani**<BR>- **Sanjeev Kumar Dass**<BR><BR>This team leads the company's operations and governance, ensuring effective management and compliance.

View full answer

What does Veto Switchgears do?

01-Sep-2026

Veto Switchgears & Cables Ltd is a micro-cap company in the electronics and appliances industry, specializing in switchgears and cables. As of June 2026, it reported net sales of 89 Cr and a net profit of 6 Cr, with a market cap of INR 235 Cr.

Overview:<BR>Veto Switchgears & Cables Ltd operates in the electronics and appliances industry, categorized as a micro-cap company.<BR><BR>History:<BR>The company was originally incorporated as a Partnership Firm in 2003 under the name "Veto Industries." It transitioned to "Veto Switchgears and Cables" in 2007 and was converted into a private company later that year. The name was changed to "Veto Switchgears and Cables Limited" in 2012. The most recent quarterly results reported net sales and net profit for June 2026.<BR><BR>Financial Snapshot:<BR>Net Sales: 89 Cr (Quarterly Results - Jun 2026) <BR>Net Profit: 6 Cr (Quarterly Results - Jun 2026) <BR>Market Cap: INR 235 Cr (Micro Cap)<BR><BR>Key Metrics:<BR>P/E: 9.00 <BR>Industry P/E: 48 <BR>Dividend Yield: 0.79% <BR>Debt-Equity: 0.07 <BR>Return on Equity: 8.67% <BR>Price to Book: 0.83 <BR><BR>Contact Details:<BR>Address: 506 5 Flr Plot B-9 New Link Rd, Landmark Building Andheri (W) Mumbai Maharashtra : 400058 <BR>Tel: 91-141-4100400 <BR>Email: cs.vandana@vetoswitchgears.com <BR>Website: http://www.vetoswitchgears.com

View full answer

Who are the peers of the Veto Switchgears?

01-Sep-2026

Veto Switchgears' peers include Forbes & Co, Sharp India, BPL, Maruti Interior, Inflame Appliances, Sonam, Macobs Technologies, Greenchef Appliances, and Arham Tech. Veto Switchgears has average management risk, excellent capital structure, and a 1-year return of 8.95%, while peers show varying levels of management risk, growth, and returns.

Peers: The peers of Veto Switchgears are Forbes & Co, Sharp India, BPL, Maruti Interior, Inflame Applian., Sonam, Macobs Technolo., Greenchef Appli., and Arham Tech.<BR><BR>Quality Snapshot: Excellent management risk is observed at Forbes & Co and Inflame Applian., while Average management risk is found at Veto Switchgears, Maruti Interior, Sonam, and Arham Tech. Below Average management risk is present at BPL, Sharp India, Macobs Technolo., and Greenchef Appli. For growth, Good growth is seen at Inflame Applian. and Arham Tech, Average growth is noted at Sonam and Veto Switchgears, while Below Average growth is reported for Forbes & Co, BPL, Sharp India, Maruti Interior, Macobs Technolo., and Greenchef Appli. In terms of capital structure, Excellent capital structure is attributed to Veto Switchgears, Good capital structure is found at Forbes & Co, BPL, Maruti Interior, Sonam, and Macobs Technolo., while Below Average capital structure is noted at Inflame Applian. and Greenchef Appli.<BR><BR>Return Snapshot: Sharp India has the highest 1-year return at 108.56%, while Forbes & Co has the lowest at -38.06%. Veto Switchgears has a 1-year return of 8.95%, which is higher than Forbes & Co but lower than Sharp India. Additionally, the six-month returns for BPL, Maruti Interior, Inflame Applian., and Greenchef Appli. are negative.

View full answer

How big is Veto Switchgears?

01-Sep-2026

As of 31st August, Veto Switchgears & Cables Ltd has a market capitalization of 235.00 Cr, with recent net sales of 411.21 Cr and a net profit of 27.36 Cr.

As of 31st August, Veto Switchgears & Cables Ltd has a market capitalization of 235.00 Cr, categorized as a Micro Cap.<BR><BR>In the latest four quarters, Veto Switchgears reported Net Sales of 411.21 Cr and a Net Profit of 27.36 Cr.<BR><BR>The latest annual period for the balance sheet is March 2025, with Shareholder's Funds amounting to 266.45 Cr and Total Assets of 327.74 Cr.

View full answer

Should I buy, sell or hold Veto Switchgears & Cables Ltd?

14-Aug-2026

Are Veto Switchgears & Cables Ltd latest results good or bad?

30-May-2026

Veto Switchgears & Cables Ltd's latest results show strong revenue growth of 55.71% year-on-year, with net sales of ₹138.86 crores and a net profit increase of 33.23%. However, declining operating and profit margins indicate challenges in cost management, suggesting mixed overall performance.

Veto Switchgears & Cables Ltd's latest results present a mixed picture. On the positive side, the company reported a significant revenue increase of 55.71% year-on-year for Q4 FY26, with net sales reaching ₹138.86 crores. This growth reflects strong demand and effective order execution, marking the highest quarterly revenue in the company's recent history.<BR><BR>Additionally, net profit for the quarter stood at ₹8.78 crores, which is a 33.23% increase compared to the previous quarter, indicating a positive trend in profitability. The stock has also shown positive momentum, with a gain of 1.72% on the day of the results announcement and a notable appreciation over the past week and month.<BR><BR>However, there are concerns regarding profitability. The operating margin has contracted to 9.55%, down from 12.16% in the same quarter last year, indicating challenges in managing costs amidst rising input prices. The profit after tax margin also declined from 8.23% to 6.34% year-on-year, which raises questions about the company's pricing power and overall cost management.<BR><BR>In summary, while Veto Switchgears has demonstrated strong revenue growth, the declining margins and profitability metrics suggest that the company is facing significant challenges that could impact its future performance. Investors should monitor these trends closely as they evaluate the company's potential.

View full answer

When is the next results date for Veto Switchgears & Cables Ltd?

26-May-2026

The next results date for Veto Switchgears & Cables Ltd is 28 May 2026.

The next results date for Veto Switchgears & Cables Ltd is scheduled for 28 May 2026.

View full answer

Is Veto Switchgears overvalued or undervalued?

24-Nov-2025

As of November 21, 2025, Veto Switchgears is considered very attractive with a PE ratio of 10.35, a price-to-book value of 0.79, and a PEG ratio of 0.54, indicating it is undervalued compared to peers like Polycab India and Havells India, despite a recent decline in stock performance.

As of 21 November 2025, Veto Switchgears has moved from an attractive to a very attractive valuation grade, indicating a significant positive shift in its perceived value. The company is currently undervalued, with a PE ratio of 10.35, a price-to-book value of 0.79, and an EV to EBITDA ratio of 7.55, which are all favorable compared to industry standards.<BR><BR>In comparison to its peers, Veto Switchgears stands out with a PEG ratio of 0.54, while Polycab India is classified as very expensive with a PE of 46.04, and Havells India is fair with a PE of 61.82. Additionally, Veto's return on capital employed (ROCE) is 9.24%, which is competitive within the sector. Despite a recent decline in stock performance relative to the Sensex, the company's valuation metrics suggest it is positioned well for future growth.

View full answer

How has been the historical performance of Veto Switchgears?

24-Nov-2025

Veto Switchgears has shown steady growth in net sales, reaching 300.38 Cr in March 2025, with profits also increasing, including a profit after tax of 21.82 Cr. Despite fluctuations in cash flow, the company maintains a solid financial position with total assets of 327.74 Cr.

Answer:<BR>The historical performance of Veto Switchgears shows a steady growth in net sales and profit over the years, with the latest figures indicating a net sales of 300.38 Cr for the year ending March 2025.<BR><BR>Breakdown:<BR>Veto Switchgears has demonstrated a consistent upward trend in net sales, increasing from 150.22 Cr in March 2020 to 300.38 Cr in March 2025, with a slight rise from 300.09 Cr in March 2024. The total operating income mirrors this growth, reaching 300.38 Cr in March 2025. The company's operating profit (PBDIT) has fluctuated but remains strong, reported at 34.24 Cr in March 2025, down from 38.02 Cr in March 2023. Profit before tax also showed resilience, at 29.54 Cr in March 2025, while profit after tax reached 21.82 Cr, reflecting a positive trend from 14.70 Cr in March 2021. The earnings per share have improved significantly, reaching 11.57 in March 2025 compared to 4.85 in March 2020. On the balance sheet, total assets increased to 327.74 Cr in March 2025, with total liabilities at 22.77 Cr, indicating a solid financial position. Cash flow from operating activities, however, decreased to 14.00 Cr in March 2025 from 27.00 Cr in March 2024, contributing to a net cash outflow of 6.00 Cr. Overall, Veto Switchgears has shown robust growth in sales and profitability, alongside a stable asset base, despite some fluctuations in cash flow.

View full answer

What is the technical trend for Veto Switchgears?

09-Jun-2025

As of June 2, 2025, Veto Switchgears shows a mildly bearish technical trend, influenced by daily moving averages and a monthly MACD, despite some mildly bullish signals from the weekly MACD and Bollinger Bands.

As of 2 June 2025, the technical trend for Veto Switchgears has changed from mildly bullish to mildly bearish. The weekly MACD indicates a mildly bullish stance, but the monthly MACD shows a mildly bearish trend, suggesting a divergence in time frames. The daily moving averages are mildly bearish, reinforcing the current negative sentiment. Bollinger Bands are mildly bullish on both weekly and monthly charts, which adds some support but is overshadowed by the bearish signals. The KST is mildly bullish weekly but bearish monthly, indicating mixed signals. Overall, the current technical stance is mildly bearish, driven primarily by the daily moving averages and the monthly MACD.

View full answer

Who are the top shareholders of the Veto Switchgears?

06-Jun-2025

The top shareholders of Veto Switchgears include Veto Electropowers (India) Private Limited with a 32.28% stake, individual investors with 46.37%, and four foreign institutional investors holding 0.42%. There are no mutual funds invested, and no pledged promoter holdings.

The top shareholders of Veto Switchgears include Veto Electropowers (India) Private Limited, which holds the highest promoter stake at 32.28%. Additionally, individual investors collectively own 46.37% of the company. There are also 4 foreign institutional investors (FIIs) that hold a total of 0.42%. Notably, there are no mutual funds currently invested in the company, and there are no pledged promoter holdings.

View full answer

What is the bonus history of the Veto Switchgears?

06-Jun-2025

Veto Switchgears issued a 1:10 bonus on September 6, 2013, with a record date of September 10, 2013, meaning shareholders received one additional share for every ten shares held.

Veto Switchgears has a bonus history that includes a 1:10 bonus issue announced on September 6, 2013. The record date for this bonus was September 10, 2013. This means that for every 10 shares held, shareholders received an additional share as a bonus.

View full answer

Has Veto Switchgears declared dividend?

06-Jun-2025

Yes, Veto Switchgears & Cables Ltd has declared a 10% dividend, amounting to 1 per share, with an ex-date of September 20, 2024. The company has shown significant long-term growth, with a total return of 282.94% over the last five years.

Veto Switchgears & Cables Ltd has declared a 10% dividend.<BR><BR>Dividend Details:<BR>- Percentage announced: 10%<BR>- Amount per share: 1 per share<BR>- Ex-date: 20 Sep 24<BR><BR>Dividend Yield: 0.77%.<BR><BR>Total Returns by Period:<BR>In the last 6 months, the price return was -5.37%, with a dividend return of 0%, resulting in a total return of -5.37%.<BR><BR>Over the past year, the price return was 10.11%, the dividend return was 0.81%, leading to a total return of 10.92%.<BR><BR>In the 2-year period, the price return was 28.42%, with a dividend return of 1.98%, culminating in a total return of 30.4%.<BR><BR>For the 3-year period, the price return was 42.35%, the dividend return was 3.79%, resulting in a total return of 46.14%.<BR><BR>In the 4-year period, the price return was 3.18%, with a dividend return of 3.06%, leading to a total return of 6.24%.<BR><BR>Over the last 5 years, the price return was 274.47%, with a dividend return of 8.47%, resulting in a total return of 282.94%.<BR><BR>Overall, Veto Switchgears has declared a dividend, and while the recent returns show some volatility, the long-term performance indicates significant growth, particularly in price returns over the last five years.

View full answer
iScoreScore
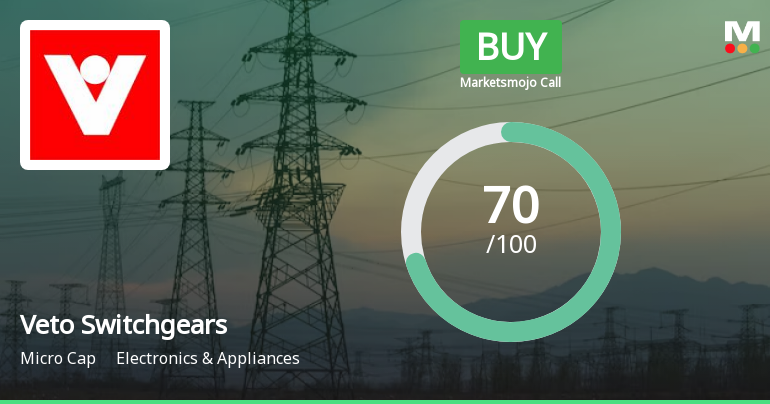
Click here to find our call on this stock
Strong Sell
Sell
Hold
Buy
Strong Buy

Dashboard

1

Company has a Debt to Equity ratio (avg) of 0.10 times

 
2

With a growth in Net Profit of 70.55%, the company declared Very Positive results in Jun 26

3

With ROE of 8.7, it has a Attractive valuation with a 0.9 Price to Book Value

4

Majority shareholders : Non Institution

 
5

Market Beating Performance

stock-summaryMojo Parameters

Mojo Parameters

Loading Valuation Snapshot...

Stock DNA

stock-summary
Industry

Electronics & Appliances

stock-summary
Market cap

INR 260 Cr (Micro Cap)

stock-summary
P/E

10.00

stock-summary
Industry P/E

44

stock-summary
Dividend Yield

0.75%

stock-summary
Debt Equity

0.07

stock-summary
Return on Equity

8.67%

stock-summary
Price to Book

0.88

Revenue and Profits:
Net Sales:
89 Cr
(Quarterly Results - Jun 2026)
Net Profit:
6 Cr
stock-summaryTotal Returns
Total Returns (Price + Dividend) stock-summary
Dividend Yield (0.75%)
TimePeriod
Price Return
Dividend Return
Total Return
3 Months
-0.07%
0.75%
0.68%
6 Months
42.01%
1.11%
43.12%
1 Year
11.33%
0.83%
12.16%
2 Years
-13.21%
1.37%
-11.84%
3 Years
11.01%
2.36%
13.37%
4 Years
21.15%
3.71%
24.86%
5 Years
33.08%
4.29%
37.37%

Latest dividend: 1 per share ex-dividend date: Sep-22-2025

Risk Adjusted Returns v/s stock-summary
Returns Beta
Icon
Beta has not been calculated since enough price history is not available
stock-summaryNews & Corporate Actions

Announcements stock-summary

Announcement under Regulation 30 (LODR)-Newspaper Publication

07-Sep-2026 | Source : BSE

In terms of Regulation 47 of the SEBI (LODR) Regulations 2015 read with the applicable circulars and notifications issued thereunder we hereby enclose the Newspaper Clippings published in the Mumbai Lakshadweep editions dated 05.09.2026 Active Time edition dated 06.09.2026 and Business Standard edition dated 07.09.2026 where a public notice has been published by way of an advertisement by the company after completion of dispatch i.e. sending of emails of notice of the 19th AGM of the company together with the Annual Report.

Announcement under Regulation 30 (LODR)-Newspaper Publication

06-Sep-2026 | Source : BSE

In terms of Regulation 47 of the SEBI(LODR) Regulation 2015 read with corresponding circulars and notifications issued thereunder we are enclosing herewith the Newspaper Clippings from the Business Standard & Mumbai Lakshadweep editions of 05th September 2026 where a public notice has been published by way of an advertisement by the Company after completion of dispatch i.e. sending of emails of Notice of the 19th AGM of the company together with the Annual Report.

Intimation Of Record Date

04-Sep-2026 | Source : BSE

Pursuant to regulation 42 of the SEBI (LODR) Regulations 2105 we hereby inform the record date i.e. 21st September 2026 for determining the entitlement of Members for payment of dividend if approved at the 19th AGM.

Corporate Actions stock-summary

stock-summary
BOARD MEETING

No Upcoming Board Meetings

stock-summary
DIVIDEND

Veto Switchgears & Cables Ltd has declared 10% dividend, ex-date: 21 Sep 26

stock-summary
SPLITS

No Splits history available

stock-summary
BONUS

Veto Switchgears & Cables Ltd has announced 1:10 bonus issue, ex-date: 06 Sep 13

stock-summary
RIGHTS

No Rights history available

stock-summaryKey Factors

Quality key factors stock-summary

Factor
Value
Sales Growth (5y)
15.48%
EBIT Growth (5y)
10.37%
EBIT to Interest (avg)
11.00
Debt to EBITDA (avg)
0.97
Net Debt to Equity (avg)
0.07
Sales to Capital Employed (avg)
1.07
Tax Ratio
26.35%
Dividend Payout Ratio
8.64%
Pledged Shares
0
Institutional Holding
0.41%
ROCE (avg)
11.14%
ROE (avg)
8.44%

Valuation key factors

Factor
Value
P/E Ratio
10
Industry P/E
44
Price to Book Value
0.91
EV to EBIT
7.75
EV to EBITDA
6.95
EV to Capital Employed
0.92
EV to Sales
0.69
PEG Ratio
0.31
Dividend Yield
0.72%
ROCE (Latest)
10.82%
ROE (Latest)
8.67%

Technicals key factors

Indicator
Weekly
Monthly
MACD
Bullish
Bullish
RSI
No Signal
No Signal
Bollinger Bands
Bullish
Bullish
Moving Averages
Bullish (Daily)
KST
Mildly Bearish
Mildly Bullish
Dow Theory
Mildly Bullish
Mildly Bearish
OBV
No Trend
Mildly Bearish
stock-summary Technical Indicator Scale: Bearish, Mildly Bearish, Sideways, Mildly Bullish, Bullish  Turned 
stock-summaryShareholding
Shareholding Snapshot : Jun 2026stock-summary
Shareholding Compare (%holding) stock-summary
Majority shareholders

Non Institution

Pledged Promoter Holdings

None

Mutual Funds

Held by 0 Schemes

FIIs

Held by 3 FIIs (0.41%)

Promoter with highest holding

Veto Electropowers (india) Private Limited (32.28%)

Highest Public shareholder

Rishabh Pant (2.67%)

Individual Investors Holdings

46.99%

stock-summaryFinancial
[
  {
    "link": "quarterly",
    "btn_text": "All Quarterly Results",
    "header": "Quarterly Results Snapshot (Consolidated) - Jun'26 - YoY",
    "rhs": [
      {
        "prefix": "Net Sales ",
        "suffix": "YoY Growth in quarter ended Jun 2026 is 37.75% vs 5.98% in Jun 2025",
        "dir": 1
      },
      {
        "prefix": "Consolidated Net Profit ",
        "suffix": "YoY Growth in quarter ended Jun 2026 is 60.43% vs -23.92% in Jun 2025",
        "dir": 1
      }
    ],
    "table": {
      "header": [
        "Jun'26",
        "Jun'25",
        "Change(%)"
      ],
      "body": [
        {
          "field": "Net Sales",
          "val1": "89.36",
          "val2": "64.87",
          "chgp": "37.75%",
          "chgp_class": "positive"
        },
        {
          "field": "Operating Profit (PBDIT) excl Other Income",
          "val1": "9.44",
          "val2": "6.29",
          "chgp": "50.08%",
          "chgp_class": "positive"
        },
        {
          "field": "Interest",
          "val1": "0.74",
          "val2": "0.63",
          "chgp": "17.46%",
          "chgp_class": "negative"
        },
        {
          "field": "Exceptional Items",
          "val1": "0.00",
          "val2": "0.00",
          "chgp": "",
          "chgp_class": "neutral"
        },
        {
          "field": "Consolidate Net Profit",
          "val1": "5.92",
          "val2": "3.69",
          "chgp": "60.43%",
          "chgp_class": "positive"
        },
        {
          "field": "Operating Profit Margin (Excl OI)",
          "val1": "10.56%",
          "val2": "9.70%",
          "chgp": "0.86%",
          "chgp_class": "positive"
        }
      ]
    }
  },
  {
    "link": "half-yearly",
    "btn_text": "All Half Yearly Results",
    "header": "Half Yearly Results Snapshot (Consolidated) - Sep'25",
    "rhs": [
      {
        "prefix": "Net Sales ",
        "suffix": " Growth in half year ended Sep 2025 is 13.40% vs -2.25% in Sep 2024",
        "dir": 1
      },
      {
        "prefix": "Consolidated Net Profit ",
        "suffix": " Growth in half year ended Sep 2025 is -10.05% vs -0.18% in Sep 2024",
        "dir": -1
      }
    ],
    "table": {
      "header": [
        "Sep'25",
        "Sep'24",
        "Change(%)"
      ],
      "body": [
        {
          "field": "Net Sales",
          "val1": "153.64",
          "val2": "135.49",
          "chgp": "13.40%",
          "chgp_class": "positive"
        },
        {
          "field": "Operating Profit (PBDIT) excl Other Income",
          "val1": "14.66",
          "val2": "15.66",
          "chgp": "-6.39%",
          "chgp_class": "negative"
        },
        {
          "field": "Interest",
          "val1": "0.99",
          "val2": "0.42",
          "chgp": "135.71%",
          "chgp_class": "negative"
        },
        {
          "field": "Exceptional Items",
          "val1": "0.00",
          "val2": "0.00",
          "chgp": "",
          "chgp_class": "neutral"
        },
        {
          "field": "Consolidate Net Profit",
          "val1": "9.76",
          "val2": "10.85",
          "chgp": "-10.05%",
          "chgp_class": "negative"
        },
        {
          "field": "Operating Profit Margin (Excl OI)",
          "val1": "9.54%",
          "val2": "11.56%",
          "chgp": "-2.02%",
          "chgp_class": "negative"
        }
      ]
    }
  },
  {
    "link": "nine-monthly",
    "btn_text": "All Nine Monthly Results",
    "header": "Nine Monthly Results Snapshot (Consolidated) - Dec'25",
    "rhs": [
      {
        "prefix": "Net Sales ",
        "suffix": "YoY Growth in nine months ended Dec 2025 is 17.36% vs -4.29% in Dec 2024",
        "dir": 1
      },
      {
        "prefix": "Consolidated Net Profit ",
        "suffix": "YoY Growth in nine months ended Dec 2025 is 12.06% vs -6.77% in Dec 2024",
        "dir": 1
      }
    ],
    "table": {
      "header": [
        "Dec'25",
        "Dec'24",
        "Change(%)"
      ],
      "body": [
        {
          "field": "Net Sales",
          "val1": "247.86",
          "val2": "211.20",
          "chgp": "17.36%",
          "chgp_class": "positive"
        },
        {
          "field": "Operating Profit (PBDIT) excl Other Income",
          "val1": "24.47",
          "val2": "20.86",
          "chgp": "17.31%",
          "chgp_class": "positive"
        },
        {
          "field": "Interest",
          "val1": "1.46",
          "val2": "0.92",
          "chgp": "58.70%",
          "chgp_class": "negative"
        },
        {
          "field": "Exceptional Items",
          "val1": "0.00",
          "val2": "0.00",
          "chgp": "",
          "chgp_class": "neutral"
        },
        {
          "field": "Consolidate Net Profit",
          "val1": "16.35",
          "val2": "14.59",
          "chgp": "12.06%",
          "chgp_class": "positive"
        },
        {
          "field": "Operating Profit Margin (Excl OI)",
          "val1": "9.87%",
          "val2": "9.88%",
          "chgp": "-0.01%",
          "chgp_class": "negative"
        }
      ]
    }
  },
  {
    "link": "annual",
    "btn_text": "All Annual Results",
    "header": "Annual Results Snapshot (Consolidated) - Mar'26",
    "rhs": [
      {
        "prefix": "Net Sales ",
        "suffix": "YoY Growth in year ended Mar 2026 is 28.74% vs 0.10% in Mar 2025",
        "dir": 1
      },
      {
        "prefix": "Consolidated Net Profit ",
        "suffix": "YoY Growth in year ended Mar 2026 is 13.56% vs 23.29% in Mar 2025",
        "dir": -1
      }
    ],
    "table": {
      "header": [
        "Mar'26",
        "Mar'25",
        "Change(%)"
      ],
      "body": [
        {
          "field": "Net Sales",
          "val1": "386.71",
          "val2": "300.38",
          "chgp": "28.74%",
          "chgp_class": "positive"
        },
        {
          "field": "Operating Profit (PBDIT) excl Other Income",
          "val1": "37.72",
          "val2": "31.69",
          "chgp": "19.03%",
          "chgp_class": "positive"
        },
        {
          "field": "Interest",
          "val1": "1.97",
          "val2": "1.64",
          "chgp": "20.12%",
          "chgp_class": "negative"
        },
        {
          "field": "Exceptional Items",
          "val1": "0.00",
          "val2": "0.00",
          "chgp": "",
          "chgp_class": "neutral"
        },
        {
          "field": "Consolidate Net Profit",
          "val1": "25.13",
          "val2": "22.13",
          "chgp": "13.56%",
          "chgp_class": "positive"
        },
        {
          "field": "Operating Profit Margin (Excl OI)",
          "val1": "9.75%",
          "val2": "10.55%",
          "chgp": "-0.80%",
          "chgp_class": "negative"
        }
      ]
    }
  }
]

Quarterly Results Snapshot (Consolidated) - Jun'26 - YoYstock-summary

Jun'26
Jun'25
Change(%)
Net Sales
89.36
64.87
37.75%
Operating Profit (PBDIT) excl Other Income
9.44
6.29
50.08%
Interest
0.74
0.63
17.46%
Exceptional Items
0.00
0.00
Consolidate Net Profit
5.92
3.69
60.43%
Operating Profit Margin (Excl OI)
10.56%
9.70%
0.86%
Values in Rs Cr.
Direction Arrows
Net Sales

YoY Growth in quarter ended Jun 2026 is 37.75% vs 5.98% in Jun 2025

Direction Arrows
Consolidated Net Profit

YoY Growth in quarter ended Jun 2026 is 60.43% vs -23.92% in Jun 2025

Half Yearly Results Snapshot (Consolidated) - Sep'25stock-summary

Sep'25
Sep'24
Change(%)
Net Sales
153.64
135.49
13.40%
Operating Profit (PBDIT) excl Other Income
14.66
15.66
-6.39%
Interest
0.99
0.42
135.71%
Exceptional Items
0.00
0.00
Consolidate Net Profit
9.76
10.85
-10.05%
Operating Profit Margin (Excl OI)
9.54%
11.56%
-2.02%
Values in Rs Cr.
Direction Arrows
Net Sales

Growth in half year ended Sep 2025 is 13.40% vs -2.25% in Sep 2024

Direction Arrows
Consolidated Net Profit

Growth in half year ended Sep 2025 is -10.05% vs -0.18% in Sep 2024

Nine Monthly Results Snapshot (Consolidated) - Dec'25stock-summary

Dec'25
Dec'24
Change(%)
Net Sales
247.86
211.20
17.36%
Operating Profit (PBDIT) excl Other Income
24.47
20.86
17.31%
Interest
1.46
0.92
58.70%
Exceptional Items
0.00
0.00
Consolidate Net Profit
16.35
14.59
12.06%
Operating Profit Margin (Excl OI)
9.87%
9.88%
-0.01%
Values in Rs Cr.
Direction Arrows
Net Sales

YoY Growth in nine months ended Dec 2025 is 17.36% vs -4.29% in Dec 2024

Direction Arrows
Consolidated Net Profit

YoY Growth in nine months ended Dec 2025 is 12.06% vs -6.77% in Dec 2024

Annual Results Snapshot (Consolidated) - Mar'26stock-summary

Mar'26
Mar'25
Change(%)
Net Sales
386.71
300.38
28.74%
Operating Profit (PBDIT) excl Other Income
37.72
31.69
19.03%
Interest
1.97
1.64
20.12%
Exceptional Items
0.00
0.00
Consolidate Net Profit
25.13
22.13
13.56%
Operating Profit Margin (Excl OI)
9.75%
10.55%
-0.80%
Values in Rs Cr.
Direction Arrows
Net Sales

YoY Growth in year ended Mar 2026 is 28.74% vs 0.10% in Mar 2025

Direction Arrows
Consolidated Net Profit

YoY Growth in year ended Mar 2026 is 13.56% vs 23.29% in Mar 2025

stock-summaryCompany CV
About Veto Switchgears & Cables Ltd stock-summary
stock-summary
Veto Switchgears & Cables Ltd
Micro Cap
Electronics & Appliances
Veto Switchgears and Cables Limited was originally incorporated as a Partnership Firm on June 26, 2003 as "Veto Industries". On April 1, 2007, the Firm was changed to "Veto Switchgears and Cables" and subsequently, on June 20, 2007, the Partnership Firm was converted into the Private Company as "Veto Switchgears and Cables Private Limited" and thereafter, it got changed to 'Veto Switchgears and Cables Limited' on August 3, 2012.
Company Coordinates stock-summary
Company Details
506 5 Flr Plot B-9 New Link Rd, Landmark Building Andheri (W) Mumbai Maharashtra : 400058
stock-summary
Tel: 91-141-4100400
stock-summary
cs.vandana@vetoswitchgears.com
Registrar Details
Bigshare Services Pvt Ltd , E-2 , Ansa Industrial Estate, Saki Vihar Road, Saki Naka, Andheri (E), Mumbai