
Compare Sharp India with Similar Stocks
Dashboard
With a Negative Book Value, the company has a Weak Long Term Fundamental Strength
- Poor long term growth as Net Sales has grown by an annual rate of -0.40% and Operating profit at 0% over the last 5 years
- The company has a negative book value of Rs 141.29 crore
Flat results in Mar 26
Risky - Negative EBITDA
Stock DNA
Electronics & Appliances
INR 296 Cr (Micro Cap)
NA (Loss Making)
NA
0.00%
-0.99
15.59%
-2.10
Total Returns (Price + Dividend) 
Sharp India for the last several years.
Risk Adjusted Returns v/s
Returns Beta

News
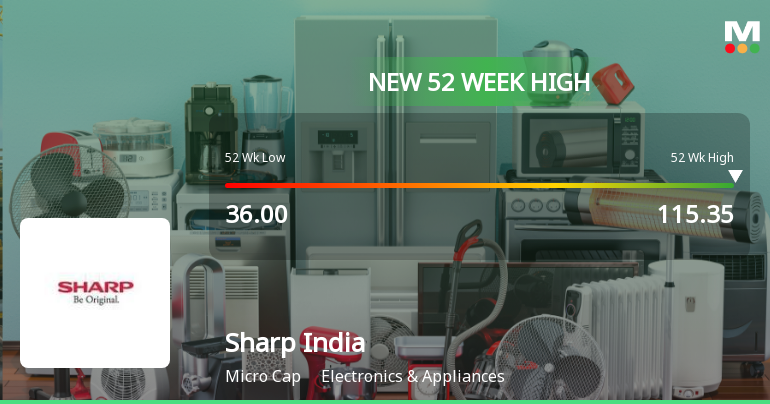
Broad-Based Technical Strength Lifts Sharp India Ltd to 52-Week High of Rs 115.35
With a near doubling in price over the past year, Sharp India Ltd surged to a fresh 52-week high of Rs 115.35 on 15 Jun 2026, marking a significant milestone in its price momentum despite a modest underperformance relative to its sector on the day.
Read full news article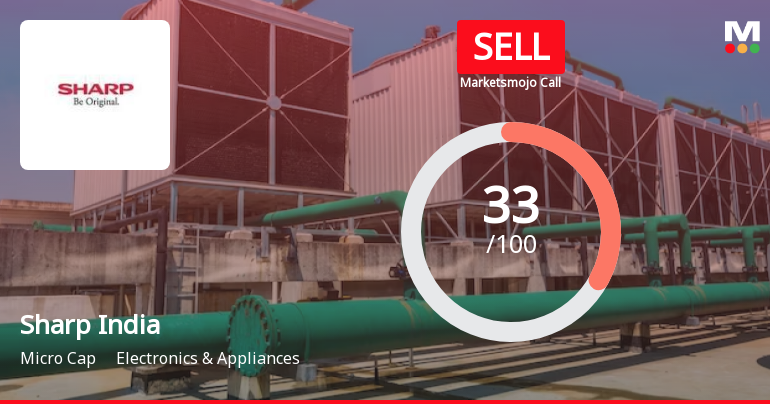
Sharp India Ltd is Rated Sell by MarketsMOJO
Sharp India Ltd is rated 'Sell' by MarketsMOJO, with this rating last updated on 28 April 2026. However, the analysis and financial metrics discussed here reflect the stock's current position as of 12 June 2026, providing investors with the latest insights into the company’s performance and outlook.
Read full news article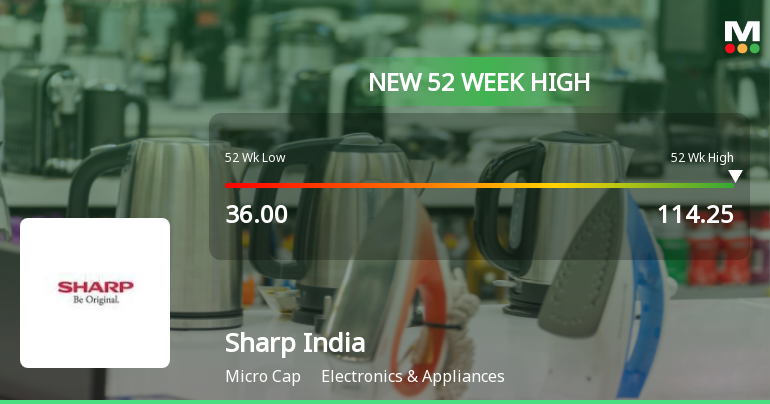
Broad-Based Technical Strength Lifts Sharp India Ltd to 52-Week High of Rs 114.25
Surging from a 52-week low of Rs 36 to a fresh high of Rs 114.25, Sharp India Ltd has delivered an impressive 83.7% gain over the past year, significantly outpacing the Sensex’s 10.3% decline. This milestone reflects a powerful technical momentum that has propelled the stock well above all key moving averages, signalling robust price strength amid a challenging broader market backdrop.
Read full news article Announcements
Announcement under Regulation 30 (LODR)-Newspaper Publication
16-Jun-2026 | Source : BSEBSE Intimation for newspaper publish of Special window on 16 06 2026.
Announcement under Regulation 30 (LODR)-Open Offer - Updates
15-Jun-2026 | Source : BSEIntimation of pre offer advertisement in terms of Regulation 18(7) of SEBI (SAST ) Regulation 2011
Updates on Open Offer
15-Jun-2026 | Source : BSENavigant Corporate Advisors Ltd. (Manager to the Offer) has submitted to BSE a copy of Offer Opening Public Announcement to the Shareholders of Sharp India Ltd (Target Company).
Corporate Actions

No Upcoming Board Meetings

No Dividend history available

No Splits history available

No Bonus history available

No Rights history available
Quality key factors
Valuation key factors
Technicals key factors
 Technical Indicator Scale: Bearish, Mildly Bearish, Sideways, Mildly Bullish, Bullish Turned
 Shareholding Snapshot : Mar 2026
Shareholding Compare (%holding)
Promoters
None
Held by 2 Schemes (0.01%)
Held by 3 FIIs (0.31%)
Sharp Corporation (75.0%)
Mayur V Shah (2%)
23.42%
Quarterly Results Snapshot (Standalone) - Mar'26 - YoY
YoY Growth in quarter ended Mar 2026 is 0.00% vs 0.00% in Mar 2025

YoY Growth in quarter ended Mar 2026 is -24.51% vs 5.77% in Mar 2025
Half Yearly Results Snapshot (Standalone) - Sep'25

Growth in half year ended Sep 2025 is 0.00% vs -100.00% in Sep 2024
Growth in half year ended Sep 2025 is -30.94% vs -25.39% in Sep 2024
Nine Monthly Results Snapshot (Standalone) - Dec'25
YoY Growth in nine months ended Dec 2025 is 0.00% vs -100.00% in Dec 2024
YoY Growth in nine months ended Dec 2025 is -25.75% vs -25.60% in Dec 2024
Annual Results Snapshot (Standalone) - Mar'26
YoY Growth in year ended Mar 2026 is 0.00% vs 0.00% in Mar 2025
YoY Growth in year ended Mar 2026 is -25.45% vs -8.07% in Mar 2025
About Sharp India Ltd

Company Coordinates


